Impact Factor ISSN: 1449-1907

 Global reach, higher impact
Int J Med Sci 2011; 8(2):126-138. doi:10.7150/ijms.8.126 This issue Cite
Research Paper
High Dose Astaxanthin Lowers Blood Pressure and Increases Insulin Sensitivity in Rats: Are These Effects Interdependent?
Harry G. Preuss1 ![]() , Bobby Echard1, Eiji Yamashita2, Nicholas V. Perricone3
, Bobby Echard1, Eiji Yamashita2, Nicholas V. Perricone3
1. Georgetown University Medical Center, Department of Biochemistry, Washington, D.C. 20057, USA
2. Life Science Division, Fuji Chemical Industry Co., Ltd., Toyama 930-0397, Japan
3. Michigan State University College of Human Medicine, East Lansing, MI 48824-136, USA
Received 2010-9-19; Accepted 2011-2-4; Published 2011-2-9
Abstract
The present investigation in Sprague-Dawley rats (SD) was designed to examine effects of astaxanthin (Asta) at different doses on elevated blood pressure (BP) and glucose-insulin perturbations produced by heavy sucrose ingestion. We also examined effects of Asta on BP during restraint stress. SD were divided into six groups each containing eight rats. All SD ate a basic diet of ground regular rat chow with sucrose added at 30% w/w. The Control group received only the basic diet containing added sucrose, while the other five groups each received the same diet with added test material: captopril, (30 mg/Kg), pioglitazone (15.0 mg/Kg), low Asta (25 mg/Kg), medium Asta (50 mg/kg) or high Asta (100 mg/Kg). Many tests were carried out to examine the mechanisms behind the effects of Asta on BP (serum ACE activity, losartan challenge, and LNAME challenge) and the glucose-insulin system (glucose tolerance, HOMA measurement, and insulin challenge). In SD, a relatively low dose of Asta decreased SBP, but produced no major changes in the glucose-insulin system simulating results from a previous study using Zucker Fatty Rats. Increasing the dose of Asta resulted in both a lowering of elevated systolic BP and enhanced insulin sensitivity determined by many different estimations. BP lowering was consistent with changes in the renin-angiotensin (RAS) and nitric oxide (NO) systems. At the examined doses of each, captopril lowered BP in SD without influencing glucose-insulin metabolism, whereas pioglitazone favorably affected glucose-insulin metabolism while showing essentially no effects on BP. Accordingly, Asta beneficially affects both sucrose-induced elevations of BP and insulin resistance at relatively high doses in SD. Also, Asta at higher doses lessens restraint stress, whereas, captopril and pioglitazone did not at the doses examined, even though they influenced the BP and glucose-insulin systems respectively.
Keywords: Astaxanthin, BP effect, Insulin resistance, Restraint stress, renin-angiotensin system
INTRODUCTION
In a recent study examining effects of astaxanthin (Asta) on elevated blood pressure (BP) and glucose-insulin perturbations in Zucker Fatty Rats (ZFR), we found under conditions examined that this carotenoid at the doses under investigation lowered systolic BP (SBP) consistently, but had no significant influences on glucose-insulin metabolism [1]. Our findings in the ZFR, considered by many to be an excellent model of the Metabolic Syndrome [2-4], raised two difficulties in interpreting the data: (1) studies from other laboratories had found that Asta ameliorates both BP elevations and glucose-insulin perturbations [5] and (2) previous reports had strongly suggested that hypertension and other chronic disturbances making up the Metabolic Syndrome are driven by the development of insulin resistance [5-7]. Plausible explanations for the first disparity are the differences in dosing and/or rat species used among the various studies. Concerning the second need for clarification, further corroboration of the lack of direct dependence between insulin resistance and hypertension is necessary to substantiate this possibility.
Accordingly, the purpose of the present investigation was to compare with our original results the effects of Asta at different doses and in a different species of rat, Sprague-Dawley (SD), on BP and glucose-insulin perturbations. As a secondary gain, we wished to determine whether Asta ameliorates other forms of stress similar to previous findings with heat stress [1].
MATERIAL AND METHODS
Protocol
The Animal Welfare Board at Georgetown University Medical Center approved the protocol for this investigation. Forty-eight male Sprague-Dawley rats (SD), obtained from Taconic Farms, Germantown, NY, were used. The SD, weighing between 252-324 g at the beginning of the studies, were housed in a constant temperature room with a light-dark phase of 12 hours each. The SD were divided into six groups, each containing eight rats. The Control group received only the basic diet containing the added sucrose, while the other five groups each received the basic diet with added sucrose containing on a weight of chow basis: captopril, (30 mg/Kg), pioglitazone (15.0 mg/Kg), low Asta (25 mg/Kg), medium Asta (50 mg/kg) or high Asta (100 mg/Kg). The amount of Asta added was based on 2% w/w content of astaxanthin to Haematococcus pluvialis powder1.
The SD were followed for approximately eight months while consuming their respective diets. Body weights and SBP were routinely measured. At the two month and eight month periods of study, specialized tests [intraperitoneal glucose-tolerance (ipGTT), insulin-challenge (ICT), losartan challenge, homeostatic model assessment (HOMA-IR), and Nw-nitro-L arginine-methyl ester hydrochloride (LNAME) challenge] along with blood chemistry assessments were carried out. Details of the procedures are given below.
Body Weight (BW)
BW was estimated by routine scale measurements. Two reading taken at least 10 minutes apart on the given day had to be within two grams of each other or the procedure was repeated until the weights were consistently within the two gram range.
Food and Water Intake
Food and water intakes were estimated close to the midpoint of the study (Day 121) by subtracting the volume or weight of the remaining fluid and food from the amounts premeasured 24 hours earlier.
Blood Pressure (BP)
SBP was measured by tail plethysmography [8] using two different instruments. As in many of our previous studies and for the majority of our measurements, we used an instrument from Narco Biosciences (Houston, TX) [9,10]. This allowed us to rapidly measure SBP with a beeper sound system. The second reading was performed on an instrument obtained from Kent Scientific Corporation (Torrington, CT). This is a computerized, non-invasive tail cuff acquisition system that utilizes a specially designed differential pressure transducer to non-invasively measure the blood volume in the tail. The latter instrument not only allowed us to record SBP, but also diastolic BP (DBP), mean BP (MBP), and cardiac rate. A previous report showed that the SBP readings were essentially similar between the two instruments [11]. Rats were allowed free access to their diet and water until SBP and the other cardiovascular readings were obtained after a slight warming between 13.00 h and 17.00 h. Multiple readings on individual rats at each session were taken. To be accepted, SBP measurements on a given rat had to be virtually stable. Over the course of study, readings were recorded at multiple time points.
In most cases, the following tests were carried out at two (weeks 7-9) and eight (weeks 31-33) months to give an acute and sub chronic reading.
Blood Chemistries
Blood for chemical analysis was obtained at two and eight months following removal of food the night before. Chemistry data were obtained via dry chemistry procedures using a Johnson and Johnson Vitros 250 instrument. The glucose and insulin levels from the fasting bloods were used to derive a homeostatic model assessment (HOMA-IR) value to assess insulin sensitivity [12]. Immunoreactive rat insulin was determined on fasting blood specimens by radioimmunoassay (Diagnostic Products Corporation, Los Angeles CA).
Intraperitoneal glucose tolerance test (ipGTT)
During the ipGTT, performed at two and eight months, glucose (2.5 g/Kg BW) was injected intraperitoneally (i.p.) to challenge tolerance. Drops of blood were obtained from the rat tail at 0, 15, 30, 60, and 120 minutes post injection. Statistical comparisons of serum glucose were made by differences from initial baseline in area under the curve (AUC) over the two hours of study. Glucose was estimated using commercial glucose strips (Lifescan, One Touch Ultra, Melitas, CA).
Insulin Challenge Testing (ICT)
Testing was commenced after 17-19 hours of food deprivation at two and eight months. For ICT, 0.6 unit of regular insulin/kg BW (Eli Lilly Co., Indianapolis, IN) was administered intraperitoneally (i.p.) to determine the decrease in glucose levels from the initial baseline. Blood for glucose determinations was obtained from the tail vein at 7.5 minutes after injection. Glucose was estimated using commercial glucose strips (Lifescan, One Touch Ultra, Melitas, CA). At the two months level, a variation of this procedure was carried out where both glucose 250 mg/Kg and 0.6 units of regular insulin/kg were injected simultaneously, and the glucose rise above baseline was measured. In the first test, a greater decrease in glucose levels soon after insulin injection before various checks and balances can come into significant play suggests greater sensitivity; and in the second procedure, a lesser early elevation in circulating glucose after glucose challenge suggests greater sensitivity to insulin.
Losartan Challenge
This test using the angiotensin receptor blocker, losartan, was also performed at two and eight months. After performing baseline SBP readings, SD from all dietary groups were given 20 mg/kg losartan orally via gastric lavage [13]. Three and six hours after lavage, SBP was remeasured. The decreased SBP after losartan was used to estimate activity of the RAS with a greater decrease in SBP connoting augmented system activity [14]. Previous studies established that the lowest values of BP reached a plateau for a couple of hours after the 6h mark.
Serum angiotensin converting enzyme (ACE) Activity
ACE refers to the angiotensin converting enzyme. ACE, necessary for the production of angiotensin 2 which is chiefly responsible for the presser effect in the RAS system, was measured by a commercial kit (Sigma Co. Ltd, St. Louis, MO) [15]. This spectrophotometric method utilizes the synthetic tripeptide substrate N-[3-(2-furyl)acryloyl]--phenylalanylglcylglcine (FAPGG). FAPGG is hydrolyzed by ACE to furylacryloylphenylalanine (FAP) and glycylglycine. Hydrolysis of FAPGG results in a decreased absorbency at 340 nm. Serum ACE activity was determined by comparing the sample reaction rate to that obtained with an appropriate ACE calibrator.
Nw-nitro-L arginine-methyl ester hydrochloride (LNAME) Challenge
Effects of nitric oxide synthase (NOS) inhibition on SBP were measured [13]. After baseline measurements of SBP, the NOS inhibitor Nw-nitro-L arginine-methyl ester hydrochloride (LNAME) was given intraperitoneally (i.p.) at a dose of 10 mg/kg. Each rat received a single dose of LNAME. Measurements of SBP were taken at four, seven, 10, 15, and 20 minutes post injection. The area under the curve relative to baseline was used to estimate activity of the NO system with a greater increase in SBP connoting augmented system activity.
Statistical Analyses
Results are presented as mean ± SEM. SBP and BW were examined by repeated measures, 2-way analyses of variance (one factor being group and the second factor being time of examination). Where a significant effect of regimen was detected by repeated measures ANOVA (p<0.05), the Dunnett t test was used to establish which differences between means reached statistical significance [16]. When the data from two columns were analyzed at a single time point, Student's t test was used. Statistical significance was set at a p < 0.05.
RESULTS
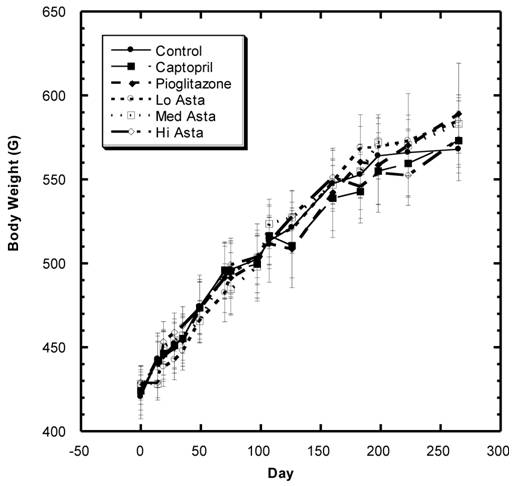
Body Weight (Fig.1)
There was a steady increase in mean body weight in all groups over the eight months of study in these SD (Fig. 1). Examining the overall data over the course of study shows that the changes in weight were reasonably similar in all groups during the study with no statistically significant differences at any time point.
Body weight (BW) of SD in Control, Captopril, Pioglitazone, Low, Medium. High Astaxanthin groups over the course of study. Data are expressed as average ±SEM.
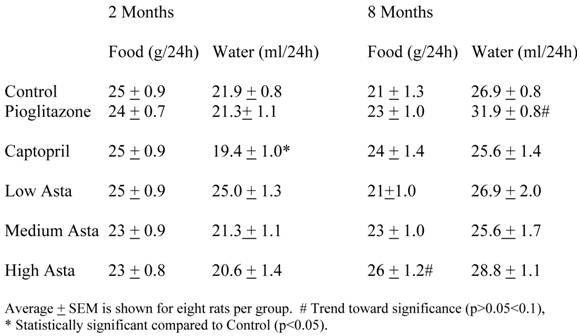
Food and Water Intake (Table 1)
The food and water consumption two months into the study and at the end of study are depicted in Table 1. There were no significant differences in the 24-hour food ingestion, and water intake was similar in all groups with the exception of the SD taking captopril in their food at two months. These rats had a lower average water intake compared to Control that was not seen at eight months. The Pioglitazone group showed a trend toward a higher water intake at eight months.
Food and Water Intake
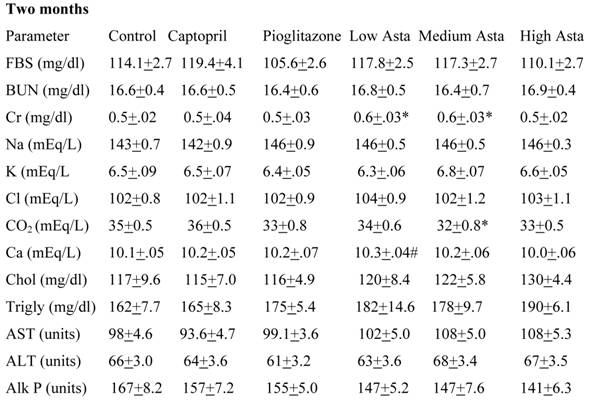
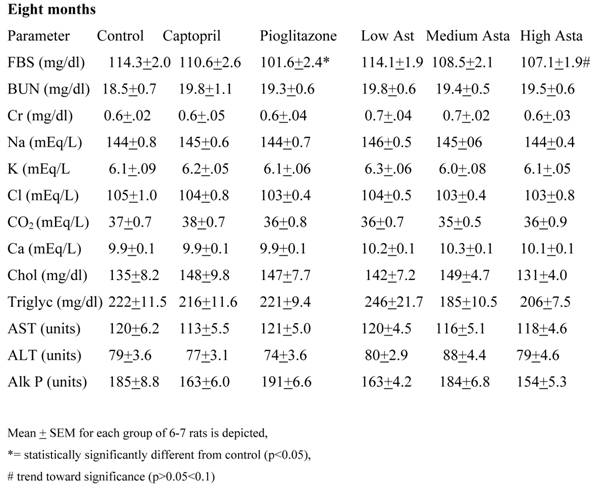
Blood Chemistries (Table 2)
Data are given for blood chemistry values at two months and at eight months. At two months, serum creatinine was significantly elevated in the Low Asta and Medium Asta groups. CO2 was decreased in Medium Asta group, and there was a trend for low calcium in the Low Asta group compared to Control. At eight months, none of these same significant differences were seen. However, the circulating levels of glucose were statistically significantly lower in the Pioglitazone group, and a trend was present for the High Asta group (p=.096) compared to Control. While lower, the mean value for the Medium Asta group did not attain statistical significance. None of the values for the other 12 chemistries at the eight months evaluation showed statistically significant differences.
Blood Chemistries
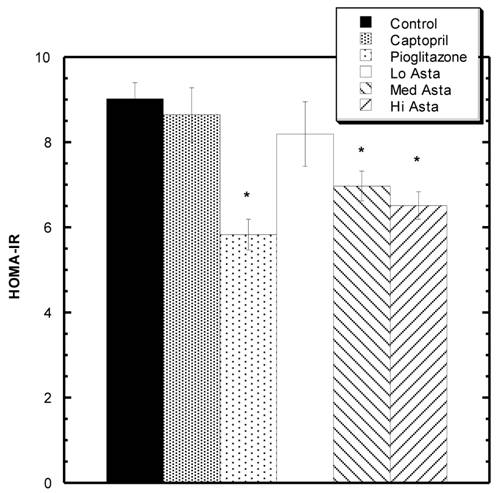
Homeostatic Model Assessment (HOMA-IR) Analysis: (Fig 2)
At two months, blood was also drawn to measure insulin levels. Average circulating insulin levels in each group reported as ng/ml ±SEM were as follows: Control 1.36+.08, Captopril 1.23±.06, Pioglitazone 0.94±.05, Low Asta 1.21±.10, Medium Asta 1.01±.07, and High Asta 1.00±.07. The values for the Pioglitazone, Medium and High Asta groups were statistically significantly lower than Control. When converted to HOMA-IR units, a commonly used means to assess insulin sensitivity [12], the same groups were still significantly lower than Control suggesting enhanced insulin sensitivity compared to Control (Fig 2).
HOMA-IR values at the end of two months. * indicates groups significantly different from Control. Mean ± SEM depicted. n=8 in each group.
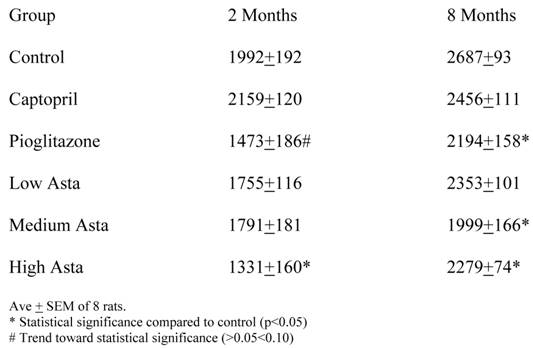
Intraperitoneal Glucose Tolerance Test (ipGTT) (Table 3)
At two months, area under the curve (AUC) above initial baseline values for the one-hour ipGTT was lowest in the High Asta group and was statistically significantly different from Control. Values in the Pioglitazone group showed a trend toward being significantly lower. At eight months, the average values for the area under the curve (AUC) were significantly lower in the Pioglitazone, Medium and High Asta groups.
60 Minute GTT at 2 and 8 Months (AUC)
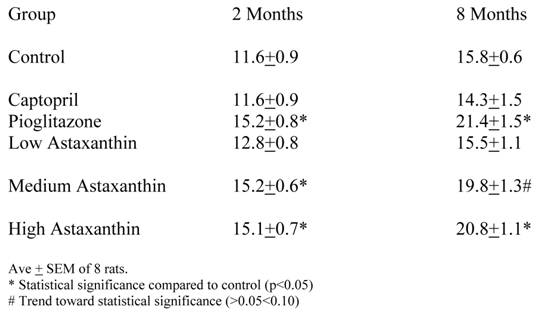
Insulin Challenge Test (ICT) (Table 4)
Both the control and treatment groups were challenged with intraperitoneal (i.p.) regular insulin. At two months, 15 minutes after regular insulin challenge, the decrease in circulating glucose levels was significantly greater in the Pioglitazone, Medium and High Asta groups compared to Control. Results were near similar when the procedure was repeated at 8 months. The only difference was that the Medium Asta group showed only a trend toward statistical significance this time. A variation of this challenge was undertaken at the two month time. With the combined challenges with insulin and glucose, the levels of circulating glucose above initial baseline at 7.5 minutes were as follows: Control 77.3 mg/dl ± 4.7 (SEM); Captopril 68.1 mg/dl ± 4.5 (SEM), Pioglitazone 59.5 mg/dl ± 3.1 (SEM); Low Asta 66.9 mg/dl ± 3.8 (SEM); Medium Asta 65.0 mg/dl ± 4.2 (SEM) and High Asta 54.9 mg/dl ±3.0 (SEM). Compared to control, these values were statistically significantly different in the Pioglitazone and High Asta groups.
ICT at 2 and 8 Months (Decrease in glucose concentration [mg/dl] at 7.5 minutes after insulin injections)
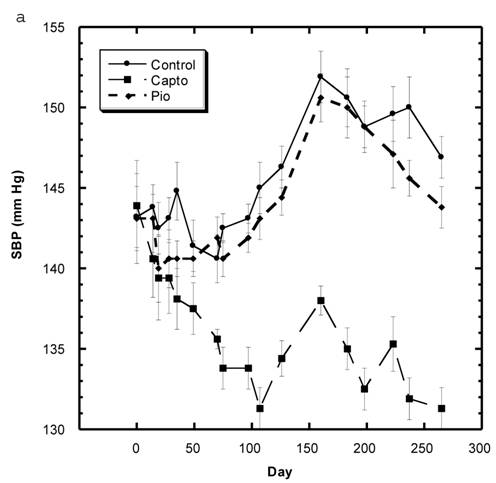
Blood Pressure (Fig. 3a, 3b, Table 5)
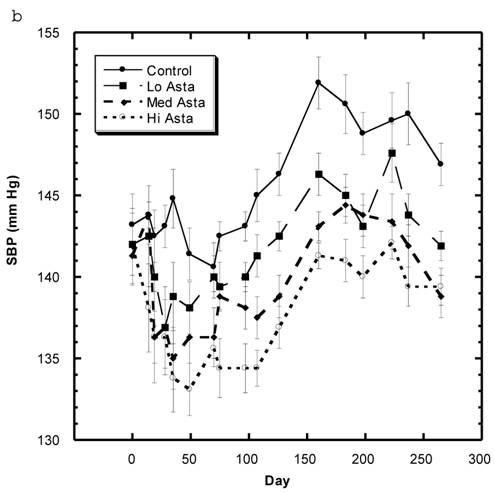
Although the SBP of all groups were obtained simultaneously, for clarity, we show the data for the Captopril and Pioglitazone groups separately (Fig. 3a) from the three test groups, Low, Medium and High Asta groups (Fig. 3b). The values for the same, single Control group are depicted in each figure. The average SBP readings of the Control group rose steadily over the initial three to four months of the present study and then leveled off around 150 mm Hg over the last few months. Fig. 3a shows that the average SBP of the group receiving captopril decreased significantly within the first few days . The relatively low readings of this group continued over the 8 months of study. Those SD in the Pioglitazone group showed virtually no change from Control throughout the remainder of the study. The readings in the High Asta group were significantly lower for the majority of readings (Fig.3b). While the tendency was for the SBP readings to be lower in the Low Asta group compared to the Control group, only three of the last readings reached statistical significance.
a) Systolic blood pressure (SBP) of SD in Control, Captopril, and Pioglitazone groups over a period of 120 days. b) SBP of SD in Control, Low, Medium and High Asta groups. Control is same in a and b. n=8 in each group. Data are expressed as mean ± SEM.
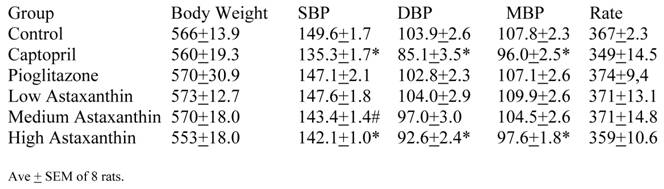
Kent BP Readings at 8 Months
The average readings for the Medium Asta group fell between the high and low groups - consistently significantly lower than Control over the last three months.
The entire BP profile and heart rate were assessed at the end of the study as shown in Table 5. Measured by another method, the SBP were comparable to the previous readings and remained significantly lower in the Captopril and High Asta groups compared to control, with the lowest average readings in the Captopril group. Likewise, the average diastolic (DBP) and mean BP (MBP) were significantly lower in the same two groups compared to Control. There were no significant differences in the cardiac rate among groups.
Renin-Angiotensin System (RAS)(Table 6)
SD challenged with losartan showed significantly less decrease in SBP in the Pioglitazone and High Asta groups compared to Control at two and eight months (Table 6). At two months compared to Control, the lesser decrease in activity in the Captopril group was a trend, while no other group showed any significant differences from Control. At eight months, the Captopril, and Medium and High Asta groups developed significantly lesser decreases in activity compared to Control.
Effects on RAS at 2 and 8 Months
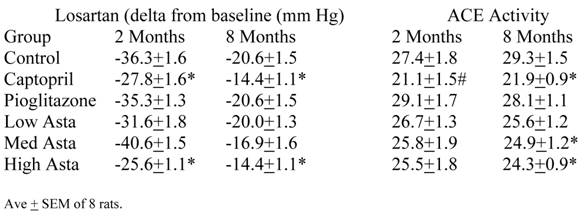
At two months, the serum angiotensin converting enzyme (ACE) activity in the Captopril group showed a trend toward lesser activity when compared to Control. However, at eight months the Captopril, Medium and Low Asta groups were statistically significantly lower than Control.
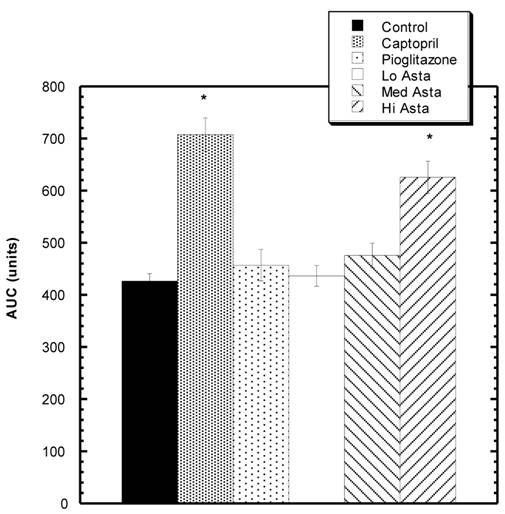
Effect of LNAME on SBP (Fig 4)
Twenty minutes after LNAME injection, there was a statistically significant increased area under the curve (AUC) compared to Control for the Captopril, and High Asta groups.
Response to L NAME challenge among various groups. Increase in SBP from baseline over 30 minutes after i.p. challenge with LNAME. The Captopril and Hi Asta groups were significantly different (*) from control over 30 minutes. n=8 in each group. Data are expressed as mean ± SEM.
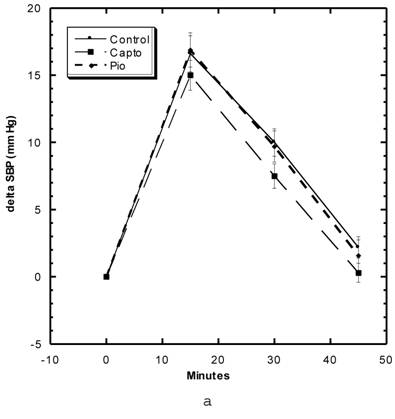
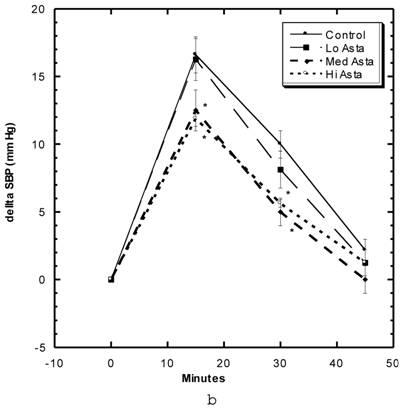
Effects of Restraint Stress on Systolic Blood Pressure (Fig 5a, 5b)
These studies were carried out in the first month of study. Within the first 15 minutes after the SD were confined in tightly-fitting, plastic tubes normally used to measure tail blood pressure, the SBP of the Control group rose roughly 15 mm Hg, began to decline to 10 mm Hg at 30 minutes and were near baseline after 45 minutes (Fig 5a). The groups of SD receiving Captopril and Pioglitazone essentially showed the same SBP change with this constraint stress as Control. The Low Asta group showed essentially the same pattern, whereas, the values for the Medium and High Asta groups were significantly lower at the 15 and 30 minute marks (Fig 5b). To evaluate the data differently, we calculated the area under the curve (AUC) relative to initial baseline for each group. The results were as follows: Control 369 ± 31.6 (SEM), Captopril 339 ± 26.6 (SEM), Pioglitazone 409 ± 45.9 (SEM), Low Asta 345 ± 27.0 (SEM), Medium Asta 253 ± 46.3 (SEM), and High Asta 277 ± 30.4 (SEM). The values for the Medium and High Asta group were significantly different from Control.
a) Systolic blood pressure (SBP) of SD in Control, Captopril, and Pioglitazone groups undergoing restraint stress. b) SBP of SD in Control, Low, Medium and High Asta groups undergoing restraint stress. Control is same in a and b. n=8 in each group. Data are expressed as mean ± SEM.
DISCUSSION
Astaxanthin has been described as “a carotenoid with potential in human health and nutrition” [17]. This is largely because astaxanthin, a substance providing red color to many living organisms such as salmon, lobsters, and shrimp, exhibits strong free radical scavenging activity by protecting against lipid peroxidation and oxidative damage of LDL-cholesterol, cell membranes, cells, and tissues [17-19]. The unique structure of the terminal ring moiety is probably behind the efficient antioxidant activity of the naturally occurring carotenoid pigment [20].
An earlier investigation reported that astaxanthin ameliorates insulin resistance [5], which seems reasonable in light of an association of antioxidants in general with insulin sensitivity [21]. However, we were unable to show this coupling of events in our previous investigation of astaxanthin in Zucker Fatty Rats (ZFR) [1]. In that investigation, we found that astaxanthin could overcome blood pressure elevated by excess sucrose ingestion despite no apparent changes in the glucose-insulin system. This observation intrigued us, because a general belief is that the major driving force behind various components of the Metabolic Syndrome is insulin resistance. This, of course, should include hypertension [5-7].
In 1980, we first reported that consuming high levels of sucrose unrelated to changes in sodium intake by three species of rats increased systolic blood pressure significantly [9]. At that time, little had been written concerning the role of sucrose ingestion in hypertension [22]. Follow up investigations eventually established that “sugar-induced blood pressure elevations” occurred in other rats species [10], and showed that fructose and sucrose compared to glucose were more effective in raising blood pressure [23] and that the pressure effects coincided with the duel presence of insulin resistance [24]. A direct link between insulin resistance and elevated SBP was made stronger when we found that trivalent chromium could overcome sucrose-induced elevations of systolic blood pressure [25]. The only generally recognized action of chromium at that time was to sensitize the insulin system [26,27]. This seemed to strengthen the hypothesis that insulin resistance had, at least in part, a direct association with elevated blood pressures caused by heavy sugar ingestion. Therefore, it was quite surprising to find that astaxanthin could lower the SBP induced by high sucrose ingestion, even though evidence of increased insulin sensitivity was not found [1].
Why the differences in the effects of astaxanthin between the two studies [1,5]? At least, two possible reasons exist: dissimilar responses of the different species used (Spontaneously Hypertensive Rats [SHR] vs. ZFR) and/or the differing dosages of astaxanthin used [1,5]. Concerning dosing, Hussein et al. [5] reported that astaxanthin gavaged at 50 mg/kg/day for 22 weeks significantly reduced arterial blood pressure, fasting blood sugar, and homeostatic model assessment (HOMA-IR) values. The latter two parameters suggest improved insulin sensitivity. Based upon body weight and the conversion factor for surface area in rats [28,29] that will be explained below, the dose of 50 mg/Kg/day is roughly equivalent to 500 mg daily for a 70 Kg human. However, the usual recommended daily dose of astaxanthin for humans is between 2-12 mg -- closer to the dose in our first study [1].
How did we arrive at our dosing schedule [1]? The doses of astaxanthin added to the food were initially based on a ratio of body weights: comparing a 500 g rat to a 70 Kg human (conversion by weight = X140). However, many believe it is more appropriate to consider surface area rather than body weight in calculating dosing as mentioned above. The conversion factor for surface area for a rat compared to a human is times seven (X7) [28,29], which makes the equivalency factor in our study X20 rather than X140. Since we estimated that rats eat approximately 25 grams of food per day, the desired daily dose was placed in that amount of food. Throughout the original study [1], the food and water intakes among the different dietary groups seemed similar - suggesting that the ZFR were consuming near the desired daily doses. We added the astaxanthin to the diet at 5 and 25 mg/Kg [1]. Thus, at 5 mg/Kg in the food, ZFR would eat about 0.125 mg daily and multiplied by 20, this would approximate a human dose of 2.5 mg daily. At 25 mg/Kg, the rats would eat five times more astaxanthin - roughly equivalent to a human daily dose of 12.5 mg daily.
To test our reasoning that the rat species and/or dosing could be responsible for the differences between studies [1,5], we simultaneously examined both parameters -- species and dosing. First, we used a rat species different from ZFR i.e., the commonly studied Sprague-Dawley (SD) albino rat. Second, in addition to using the same dose as previously (equivalent to a human dose of 12.5 mg/daily) in one group [1], we also increased the doses to levels comparable to human levels of 25 and 50 mg daily in two others. While not as high as in the previous study [5], still, these doses far exceed comparable doses recommended in humans.
At the low dose of astaxanthin in the present study (similar to the previously used one simulating a human daily dose of 12.5 mg [1]), we again saw essentially no effects on the glucose-insulin system in the SD; but we were able to see some lowering of the elevated sucrose-induced blood pressure rise (Fig, 3b). This mirrors the previous situation in the ZFR. At the highest level used (50 mg human equivalent), we were clearly able to show in SD enhanced insulin sensitivity in addition to lowered blood pressure readings (Fig. 3b). A dose-response was apparent, as results were consistently better as doses of astaxanthin were increased in the feed. Thus, dose rather than rat species was more important in explaining disparity in previous results [1,5]. The examined doses did not affect food-water intake and body weight and caused no apparent toxicities judged by blood chemistry values and observations of well-being.
Although the results with astaxanthin answered our original question, those with captopril and pioglitazone, the positive controls, raised others. Our results did not indicate an effect of captopril on insulin sensitivity, or an effect of pioglitazone on blood pressure. Captopril has been reported to enhance insulin sensitivity [30,31], and pioglitazone was previously found to lower blood pressure in fructose-fed rats [32]. Nevertheless, captopril, a well known ACE inhibitor [30], did not influence significantly any of the measured parameters that would suggest changes in insulin sensitivity, even though it lowered blood pressure. Based upon our findings, rather than insulin resistance, the blood pressure results could be due, at least in part, to changes in activity of the RAS and NO systems. The latter conclusion is based upon results from the losartan challenge, measurements of serum ACE activity, and the LNAME challenge tests. Lam et al postulated that the effect captopril on insulin sensitivity may be due to inhibiting production and/or release of endothelin-1, as well as blocking the renin-angiotensin and kinin systems [31].
The data from the Pioglitazone group were just the opposite of those from the Captopril group - showing significant enhancement of insulin sensitivity but essentially no influence on elevated blood pressure. This also suggests that insulin resistance does not necessarily cause hypertension directly in sucrose-induced elevations of blood pressure, a postulate proposed by Buchanan et al in their examination of the influences of pioglitazone in vivo in fructose-fed rats [32]. They reported a decrease in blood pressure by pioglitazone that was unrelated to fasting plasma insulin levels at a dose of pioglitazone of 400 mg/Kg - approximately 25 times greater than what we used here. While we did not show a direct effect between the status of insulin sensitivity and blood pressure, still the possibility is that we could have shown that both drugs worked on the two systems at higher doses similar to the findings with astaxanthin.
Previously, we found fortuitously in ZFR that astaxanthin ameliorated the harmful effects of heat stress [1]. Nishikawa et al [33] examined the ability of astaxanthin to overcome stress-induced gastric ulcers in rats. Ulcer indices were smaller with the rat group fed astaxanthin compared to control. Two United States patents discussed the ability of astaxanthin to be an anti stress agent [34,35]. Accordingly, we wished to expand the data on astaxanthin and stress by examining its effects on restraint stress. Similar to studies with heat stress [1], astaxanthin at the two higher doses did show significant ability to overcome the blood pressure elevation arising from restraint stress (Fig. 5b). The ability of captopril and pioglitazone to affect blood pressure and insulin sensitivity respectively but not restraint stress suggests that high dose astaxanthin does not influence restraint stress in a major fashion via the renin- angiotensin nor glucose-insulin systems, at least not individually (Fig.5a).
In conclusion, astaxanthin was able to affect both the renin-angiotensin, nitric oxide and glucose-insulin systems at relatively high doses. This carotenoid also ameliorated restraint stress at high doses. The data in the Captopril and Pioglitazone groups suggest that the anti stress effect of astaxanthin on rats are not related to influences on the RAS, NO, nor glucose-insulin systems.
Acknowledgements
The Perricone Charitable Foundation supported this work. Dr. Yamashita is employed by Fuji Chemicals of Japan who supplied the astaxanthin. Drs. Preuss, Echard and Perricone have no financial interest in the Astaxanthin product.
Conflict of Interest
With the exception of Dr. Yamashita who works for Fuji Chemical, the authors have no financial interest in the Astaxanthin product.
References
1. Preuss HG, Echard B, Bagchi D. et al. Astaxanthin lowers blood pressure and lessens activity of the renin-angiotensin system in Zucker Fatty Rats. J Functional Foods. 2009;1:13-22
2. Zucker LM, Zucker TF. Fatty, a new mutation in the rat. J Hered. 1961;52:275-8
3. Bray GA. The Zucker-fatty rat: a review. Fed Proc. 1977;36:148-53
4. Bach A, Schirardin H, Bauer M. et al. Age-related changes in biological parameters in Zucker rats. Lipids. 1981;16:841-8
5. Hussein G, Nakagawa T, Goto H. et al. Astaxanthin ameliorates features of metabolic syndrome in SHR/NDmcr-cp. Life Sci. 2007;80:522-9
6. Reaven GM. The individual components of the metabolic syndrome: is there a raison d'etre? J Amer Coll Nutr. 2007;26:191-5
7. Jornayvez FR, Samuel VT, Shulman GI. The role of muscle insulin resistance in the pathogenesis of atherogenic dyslipidemia and non alcoholic liver disease associated with the metabolic syndrome. Annual Rev Nutr. 2010;30:273-90
8. Bunag RD. Validation in awake rats of a tail-cuff method measuring systolic pressure. J Appl Physiol. 1973;34:279-82
9. Preuss MB, Preuss HG. Effects of sucrose on the blood pressure of various strains of Wistar rats. Lab Invest. 1980;43:101-7
10. Preuss HG, Fournier RD, Preuss J. et al. Effects of different refined carbohydrates on the blood pressure of SH and WKY Rats. J Clin Biochem and Nutr. 1988;5:9-20
11. Perricone NV, Bagchi D, Echard B, Preuss HG. Blood pressure lowering effects of niacin-bound chromium in sucrose-fed rats: renin-angiotensin system. J Inorganic Biochem. 2008;102:1541-8
12. Turner RC, Holman RR, Matthews D. et al. Insulin deficiency and insulin resistance interaction in diabetes: estimation of their relative contribution by feedback analysis from basal plasma insulin and glucose concentrations. Metabolism. 1979;28:1086-96
13. Wong PC, Price WA Jr, Chiu AT. et al. In vivo pharmacology of DuP 753. Am J Hypertens. 1991;4(Suppl):288s-98s
14. Mohamadi A, Jarrell ST, Dadgar-Dehkordi A. et al. Effects of wild garlic on blood pressure and other parameters of hypertensive rats: comparison with cultivated garlics. Heart Disease. 2000;2:3-9
15. Aviram M, Dornfeld L. Pomegranate juice consumption inhibits serum angiotensin converting enzyme activity and reduces systolic blood pressure. Atherosclerosis. 2001;158:195-8
16. Dunnett C. A multiple comparison procedure for comparing several treatments with control. J Am Statis Assoc. 1955;50:1096-121
17. Hussein G, Sankawa U, Goto H. et al. Astaxanthin, a carotenoid with potential in human health and nutrition. J Nat Prod. 2006;69:443-9
18. Torrissen OJ, Hardy RW, Shearer KD. Pigmentation of salmonids -- carotenoid deposition and metabolism. CRC Crit Rev Aquat Sci. 2000;1:209-25
19. Naguib Y. Pioneering astaxanthin. Nutrition Science News. 2001:1-6
20. Goto S, Kogure K, Abe K. et al. Efficient radical trapping at the surface and inside the phospholipid membrane is responsible for highly potent antiperoxidative activity of the carotenoid astaxanthin. Biochim and Biophy Acta. 2001;1512:251-8
21. Preuss H. The insulin system: influence of antioxidants. J Ameri Coll of Nutr (Editorial). 1998;17:101-2
22. Preuss HG, Fournier RD. Effects of sucrose ingestion on blood pressure. Life Sci. 1982;30:878-86
23. More NS, Rao NA, Preuss HG. Early sucrose-induced retinal vascular lesions in SHR and WKY rats. Ann Lab Clin Sci. 1986;16:419-26
24. Reaven GM, Ho H, Hoffman BB. Attenuation of fructose-induced hypertension in rats by exercise training. Hypertension. 1988;12:129-32
25. Preuss HG, Gondal JA, Bustos E. et al. Effect of chromium and guar on sugar-induced hypertension in rats. Clin Neph. 1995;44:170-7
26. Mertz W. Chromium in human nutrition: a review. J Nutr. 1993;123:626-33
27. Anderson RA. Recent advances in the clinical and biochemical effects of chromium deficiency. Essential and toxic trace elements in human health and disease: an update. New York: Wiley-Liss, Inc. 1993:221-34
28. Freireich EJ, Gehan EA, Rall DP. et al. Quantitative comparison of toxicity of anticancer agents in mouse, rat, hamster, dog, monkey, and man. Cancer Chemotherapy Reports. 1966;50:219-44
29. Reagan-Shaw S, Nihal M, Ahmad N. Dose translation from animal to human studies revisited. FASEB Journal. 2008;22:659-61
30. Scheen AJ. Prevention of type 2 diabetes mellitus through inhibition of the renin-angiotensin system. Drugs. 2004;64:2537-65
31. Lam HC, Lee JK, Chiang HT. et al. Is captopril-induced improvement of insulin sensitivity mediated via endothelin. J Cardiovasc Pharmacol. 1998;31(Suppl 1):S496-500
32. Buchanan TA, Meehan WP, Jeng YY. et al. Blood pressure lowering by pioglitazone. Evidence for a direct vascular effect. J Clin Invest. 1995;96:354-60
33. Nishikawa Y, Minenaka Y, Ichimura M. et al. Effects of astaxanthin and vitamin C on the prevention of gastric ulceration in stressed rats. J Nutr Sci Vitaminology (Tokyo). 2005;51:135-41
34. It S, Ogata E, Yamada M, Showa Denko. Anti-stress agent for animals and a method of reducing stress in animals. United States patent 5937790.
35. Asami S, Yang ZB, Yamashita E, Otoze H. Anti-stress composition. United States patent 6265450.
Footnotes
Fuji Chemical Industry Co., Ltd., Toyama 930-0397, Japan - AstaREAL P2
Author contact
![]() Corresponding author: Harry G. Preuss M.D., M.A.C.N., C.N.S., Professor of Biochemistry, Medicine, & PathologyGeorgetown University Medical Center, Basic Science Building, Room 231 B, 4000 Reservoir Road, NW, Washington, D.C. 20057. Work Phone: 202-687-1441; Fax: 202-687-8788; E mail: preusshgedu
Corresponding author: Harry G. Preuss M.D., M.A.C.N., C.N.S., Professor of Biochemistry, Medicine, & PathologyGeorgetown University Medical Center, Basic Science Building, Room 231 B, 4000 Reservoir Road, NW, Washington, D.C. 20057. Work Phone: 202-687-1441; Fax: 202-687-8788; E mail: preusshgedu