Impact Factor ISSN: 1449-1907

 Global reach, higher impact
Int J Med Sci 2011; 8(2):97-105. doi:10.7150/ijms.8.97 This issue Cite
Research Paper
Positioning Effects of KillerRed inside of Cells correlate with DNA Strand Breaks after Activation with Visible Light
Waldemar Waldeck1, Gabriele Mueller1, Manfred Wiessler2, Katalin Tóth1, Klaus Braun2 ![]()
1. German Cancer Research Center, Dept. of Biophysics of Macromolecules, INF 580, D-69120 Heidelberg, Germany
2. German Cancer Research Center, Dept. of Medical Physics in Radiology, INF 280, D-69120 Heidelberg, Germany
Received 2010-11-13; Accepted 2011-1-20; Published 2011-1-21
Abstract
Fluorescent proteins (FPs) are established tools for new applications, not-restricted to the cell biological research. They could also be ideal in surgery enhancing the precision to differentiate between the target tissue and the surrounding healthy tissue. FPs like the KillerRed (KRED), used here, can be activated by excitation with visible day-light for emitting active electrons which produce reactive oxygen species (ROS) resulting in photokilling processes. It is a given that the extent of the KRED's cell toxicity depends on its subcellular localization. Evidences are documented that the nuclear lamina as well as especially the chromatin are critical targets for KRED-mediated ROS-based DNA damaging. Here we investigated the damaging effects of the KRED protein fused to the nuclear lamina and to the histone H2A DNA-binding protein. We detected a frequency of DNA strand breaks, dependent first on the illumination time, and second on the spatial distance between the localization at the chromatin and the site of ROS production. As a consequence we could identify defined DNA bands with 200, 400 and (600) bps as most prominent degradation products, presumably representing an internucleosomal DNA cleavage induced by KRED. These findings are not restricted to the detection of programmed cell death processes in the therapeutic field like PDT, but they can also contribute to a better understanding of the structure-function relations in the epigenomic world.
Keywords: Fluorescent Proteins, KillerRed, Photo-Dynamic-Therapy (PDT), DNA strand breaks, ROS, Skin Tumors, subcellular Localization
Introduction
Various mechanisms responsible for cell toxicity have been characterized in the past [1-5]. As a leading cause chemical processes initiated by free radicals were detected, commonly specified as reactive oxygen species (ROS) originating from different sources, like ultraviolet or ionizing radiation [6]. Observations of the Gerschman and the Harman groups reach back to the early 1950s and led to the assumption for a relationship between ROS activity and toxic effects resulting in the free radical theory of aging [7, 8]. It is quite evident that aging processes are very complex; one aspect of the aging theory describes cellular damages caused by toxic metabolic products or inefficient repair systems during the lifespan [9, 10]. The human senescence and the ROS's impact on aging as well as diseases which are associated with mitochondrial DNA mutations are discussed [11-15].
The connection between ROS activity and cellular toxicity is beyond controversial. Toxic effects like killing of eukaryotic and prokaryotic cells, stably transfected with different fluorescent proteins (FP), during white light illumination were already documented [16, 17]. An appropriate candidate for our experiments is a red fluorescent protein, a variant developed and documented as KillerRed by the Bulina group. It is considered as a further ROS supplier activated by visible light acting as photosensitizer [18]. The different sensitivity of cells against ROS depends on their ability of fluorescence protein formation and is FP variant dependent [16]. Recent data elucidate different FP's toxicity dependent on the intracellular localization of the ROS producing FPs [17].
The effects are caused by different localizations of subcellular components like membranes (in mitochondria, at the nuclear envelope, in cell membranes), as well as damages of proteins of the cytoskeleton, organelles, enzymes and finally of nucleic acids. The mitochondrial and the nuclear located DNA represent exceedingly sensitive targets. We designed plasmids for expression of KillerRed and its fusions proteins KRED-Lamin B1 and H2A-KRED. We demonstrated their physical maps as well as their intracellular localization and their resulting effects as discussed by Waldeck [17].
Therefore the rationale of this manuscript is the estimation of the cell toxicity by measurements of DNA-strand breaks in cell-clones stably transfected with plasmids expressing KillerRed proteins (e.g. pKillerRed-Lamin B1) after activation with white light. KRED-Lamin B1 is located inside of the nuclear envelope. For comparison cells were transfected with pH2A-KillerRed whose histone fusion partner H2A acts as a structural protein, a crucial component of the chromosomal chromatin. In the cells the histone H2A-KRED fusion protein becomes part of the nucleosomes with a very tight distance to DNA. With these experiments and previous control experiments we could demonstrate that a very close distance of KillerRed to DNA did not allow the cells to survive. The investigated cells were grown and treated in cell culture, but illumination and the following labeling of the DNA strand breaks was carried out in isolated nuclei in the test tube (in vitro).
Material & Methods
Cell culture
DU145 human prostate cancer cells, first characterized and documented by the Stone group [19], were cultivated and maintained in RPMI1640 (Gibco 11825) amended with FCS (2%) (Gibco).
For experiments subconfluent cells were trypsinized, harvested and plated in Petri dishes (150 mm Ø). 24 hours before measurements cells were treated with the Poly [ADP-ribose] polymerase (PARP) inhibitor ABT-888 (final concentration 5µM)
Recombinatory chemistry of the fusion plasmid
The construction of the pKillerRed-Lamin B1 vector is carried out according the detailed description as documented by Waldeck [17].
Transfection procedures
For the transfection of pKillerRed-Lamin B1 into the DU145 cells, 5 × 10⁶ cells were plated in a cell culture flask (150 cm2); then 2 µg DNA and 36 µl TurboFect™ transfection reagent (Fermentas, York, UK) were added in 500 µl RPMI serum-free medium. The transfection process was finshed after 20 min. The TurboFect™, a cationic transfection reagent, is described in the manufactor's instructions and the transfections steps were carried out according to the user manual.
Isolation of nuclei
All procedures were executed on ice (max. 4°C):
DU145 cells (4.8 × 10⁶) were harvested and subsequently rinsed with Hank's Balanced Salt Solution (HBSS) (PAN P04-49505) and after centrifugation for 5 min (800 U×min-1) resuspended in isotonic Tris (137 mM NaCl; 5 mM KCl; 0.3 mM Na2HPO4×2 H20; 0.5 mM MgCl2; 0.7 mM CaCl2; and 25 mM Tris/HCl, pH 7.5). After centrifugation (identical procedure as above) the pellet was washed with isotonic Hepes (220 mM sucrose; 0.5 mM Cacl2; and 5 mM MgCl2) and promptly centrifuged as described above.
The next step was the resuspension of the cell pellet in 10 ml isotonic Hepes followed by vortexing thoroughly in presence of NP 40 (0.5%) thoroughly over 1 min and then cooling on ice (30 s). This step was repeated 3-fold and the cell-fragment suspension was resuspended in isotonic Hepes up to 50 ml and subsequently centrifuged over 4 min (2.000 U×min-1).
The resulting pellet with the cell nuclei was resuspended in 12 ml isotonic Hepes completed with 200 mM sucrose and 5 µM ABT-888.
For the following illumination studies the solution was divided to 2 × 6ml aliquots wherein 1 probe served as control.
Illumination of the nuclei
Before illumination, the solution of nuclei (4×10⁶) was pipetted in a concentration of 4×10⁶ nuclei pro ml onto Petri dishes with a glass bottom. The illumination time with visible light was between 0 min and 60 min. In 20 min steps, the probes were followed up as described as follows.
RNase digest of the nuclei
With respect to the RNA which might interfere with the DNA labeling measurements, the RNA molecules were removed using a specific RNase digest. Therefore the pellet containing nuclei was centrifuged over 5 min (3.500 U×min-1). The pellet was resuspended in 200 µl isotonic Hepes completed with 50µg/ml RNase A (Qiagen, Germany). After the digestion procedure for 5 h at 37°C the nuclear suspension was completed to 1 ml with isotonic Hepes. The mixture was centrifuged over 10 min (3.500 U×min-1) for removal of the RNA fragments, and the residual pellet was followed up.
Labeling studies ATTO633- and ATTO465-Dyes (TUNEL-like)
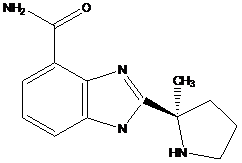
The isolated nuclei (20×106) were resuspended in a solution containing 75 µl H2O; 15 µl sucrose; 30 µl TdT reaction buffer; 30 µl CoCl2; and 0.15 µl PARP inhibitor 2-[(R)-2-Methylpyrrolidin-2-yl]-1H-benzimidazole-4-carboxamide (ABT-888) (empirical and structural formulas are examined in Figure S1).
ABT-888's pharmacokinetic and phamacodynamic properties are documented by the Frost group [20]. The empirical formula is C13H16N4O with the mol mass of 244.29 g/mol.
The DNA in the nuclei was labeled with 0.3 µl (50 µM) terminal-desoxy-nucleotidyl-transferase at 3'-Termini with ATTO-tagged desoxy-nucleotides (Cat.No.: NU-803-633, and NU-803-465 Atto-Tec, Germany) 0.3 µl (50 µM). We extended the 3'-termini with the fluorochrome which permits the detection of the strand breaks.
Probes treated with the reaction mix were incubated over night at 37°C, then completed with isotonic Hepes and centrifuged over 15 min (4.000 U×min-1) to remove the excess of the fluorescent label. The nuclei were subsequently used for the following studies.
CLSM studies
In order to estimate the intra nuclear localization as well as the extend of the ROS-induced DNA damages after activation of the KillerRed protein with white light, the confocal laser scanning microscopy was used. Therefore 5 × 10⁴ nuclei were seeded on glass slides and investigated using the confocal microscope Leica SP5. The excitation of the ATTO465 and the ATTO633 was carried out at 458 nm and 633 nm, the emission wave length range was 590 - 700 nm and 550-620 nm respectively.
Gel electrophoresis study
Using the alkaline gel electrophoresis technology, the extent of the DNA single strand damage can be visualized. For preparation of such agarose gels (pH 11) we heated 2g SeaPrep® Agarose suspended in 180 ml H2O. After cooling to 40°C 20 ml 2N NaOH was added and the gel was casted and cooled down to 4°C.
The gel was loaded with 0.3 µg DNA (in a 5% sucrose solution) and electrophoresis was carried out at 4°C during 24 h. The used electric potential was 35 V and the amperage was 10 mA.
For detection of the DNA damages, the agarose gel was stained with ethidium bromide (EtBr) intercalating into the DNA.
For detection of the labeled DNA strands visualization by the Typhoon™ imaging methodology (GE Healthcare Europe GmbH, Germany) was used. Here we scanned the identical agarose gel for fluorescent imaging. The visualization procedure was carried out according to the user manual instructions with an excitation at 633 nm and an emission wave length range of 670 ± 30 nm.
Results & Discussion
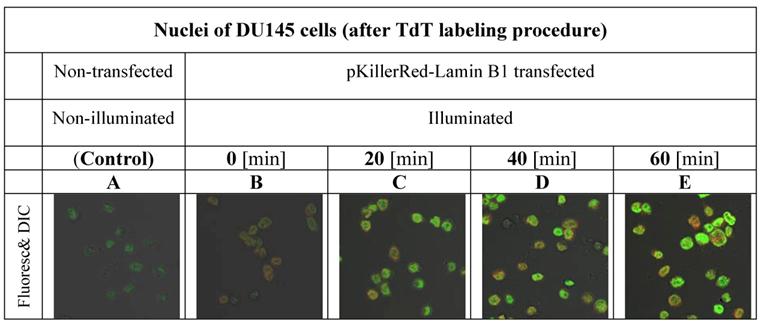
Our first aim was to investigate the varying amounts of DNA damages in the nuclei of DU145 cells after time-dependant illumination under our treatment conditions as described in the methods part and shown in Figure 1.
gives insight into the proportionality between the duration of activation and the increase of fluorescence intensity inside of the nuclei of DU145 cells.
The cellular chromatin and thereby the DNA is exposed to highly reactive ROS which induce single strand breaks in the DNA. In cells, generally, these toxic effects are eliminated by repair enzymes. Poly-(ADP-ribose)-polymerases (PARP) are members of this multi-faced repair enzyme family, wherein the PARP-1 presents the major enzyme component whose role is critical during DNA replication, transcription as well as in the repair of DNA strand breaks [21-24]. In case of the inhibition of PARP1 repair is blocked and as a consequence such DNA-damaged cells die. Strong PARP inhibitors were documented [25-27]. Here we used as PARP 1 inhibitor the efficient ABT-88 as discussed by the Giranda group [20].
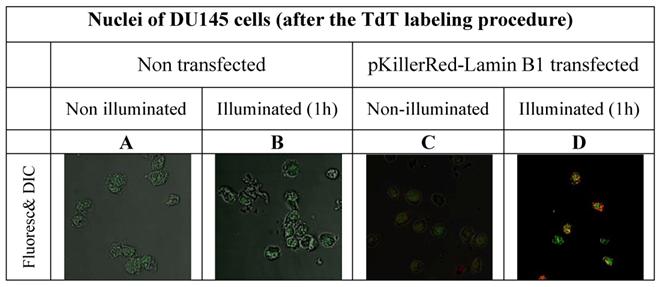
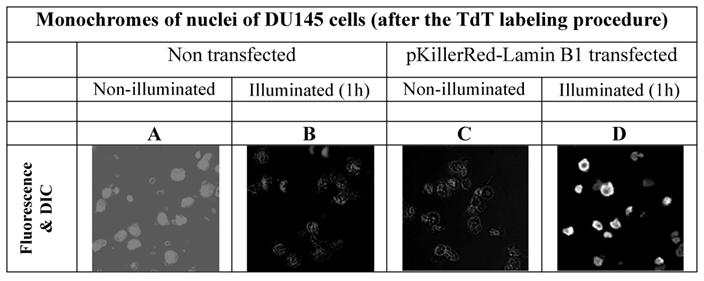
In order to avoid false positive labeling of 3' ends we removed RNA extensively and we removed the degradation products from the nuclei by extensive washing. In Figure 2 the different fluorescence intensities in nuclei of DU145 cells are shown after RNase digest, transfected and non-transfected, activated and non-activated with visible light (1h) are shown. We selected these examples to illustrate the extent of the DNA strand breaks.
visualizes the degree of the DNA damage in nuclei as a result of DNA strand breaks caused by ROS produced by the fluorescent protein KillerRed after activation with visible light. As controls, the fluorescence intensities of nuclei of DU 145 cells were measured after 3'-end labeling with fluorophore functionalized dNTP building blocks in non-transfected and in transfected but non-activated cells.
In order to possibly retain the structural properties of the nuclei we also tested an RNase treatment after illumination, but we could not find a visible difference. (However it should be annotated that during the preparation procedure, the illuminated nuclei suggested a slightly increased morphologic instability. The data of images of DU 145 cells nuclei treated with RNase after illumination are not shown).
As is apparent from the Figure 2 that we could detect only faint green fluorescence signal in the nuclei of DU145 cells which are non transfected and without illumination (Figure 2A) and a marginally increased green signal in the nuclei after 60 min illumination (Figure 2B). The fluorescence signals (red - of the fusion protein KRED-Lamin B1 and green - derived from dNTP functionalized with ATTO 633) are hardly detectable inside of the nuclei transfected with pKillerRed-Lamin B1 without activation by illumination with white light (Figure 2C). The illumination of the transfected DU 145 cells yields clear intranuclear fluorescence signals, the green fluorescence intensity correlates to the extent of 3'-endlabeling after DNA damaging induced by KRED after light activation (Figure 2D). The yellow-fluorescence signals are perinuclearly located and are caused by the merged red fluorescence of the KRED and the green fluorescence of the ATTO 633 (Figure 2D).
The extreme sensitivity of the DNA against damaging processes is documented [28-30]. Here we also investigated the question of the dependency of the spatial proximity of the ROS producing KRED protein to the DNA damage extent. Therefore we exposed DU 145 human prostate cancer cells expressing H2A-KillerRed.
The H2A histone acts as a structure protein and is part of the nuclear chromatin whereas the second half of the fusion protein, the KRED produces highly reactive radicals inducing damages [31] in the surrounding proteins and even more important at the adjacent DNA regions. In the Figure 3 the intracellular localization of the fusion protein is illustrated and shows the fluorescent signals inside of the nuclei of DU145 cells. The permanent cloning of a pH2A-KillerRed transfected DU145 cell line was not successful. The cells could not survive as clones; they changed their phenotype and their lost morphological structures, as already documented by Waldeck [17]. For this reason the fluorescence images combined with the images, as depicted in the Figure 3, could solely be generated in nuclei of DU 145 cells pH2A-KillerRed transiently transfected.
shows the nuclei of DU 145 cells, pH2A-KillerRed transfected, after labeling of DNA at 3'-termini with Terminal-desoxy-nucleotidyl-transferase (TdT) and the green fluorescent marker ATT0 633. The left picture (A) shows DU 145 cell nuclei, before the illumination procedure demonstrating low fluorescence signals. The right photograph (B) exemplifies clear nucleus localized orange and partially green fluorescence signals achieved by overlaying of green and red fluorescence signals.
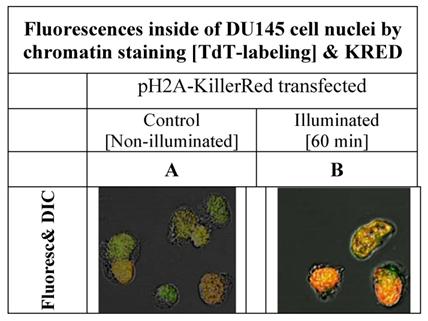
The low fluorescence signal as shown on the left side of the Figure 3A could be caused by the merged green signal of the dNTPs label functionalized with ATTO 633 with the and red fluorescence signal of the KRED protein part of the fusion protein which is inserted into the nucleus located chromatin structure (Figure 3A). The Figure 3B shows the same nuclei isolated after illumination and labeling resulting in a strong signal.
Whereas in Figure 3 the complete fluorescent nuclear chromatin is shown after 3'-DNA end labeling of the nuclear DNA strand breaks with the fluorochrome ATTO 633, the Figure 4 permits insight into the spatial effects after illumination of DU 145 cells expressing KillerRed-Lamin B1.
depicts the perinuclear localization of the fluorescence signals inside of the nuclear envelope of DU145 cells.
Additionally, as shown in Figure 4D, we tried to demonstrate a more precise nuclear localization of the DNA fluorochrome. Here the label is more distinguishably illustrated in a monochrome picture. It is evident that the highest fluorescence signal resides in the DNA located in proximity of the inner side of the nuclear envelope.
The DNA-histone organization of the intranuclear chromatin structure is well documented [32]. Concomitantly, the critical role of lamin B, a protein acting as integral part of the inner nuclear membrane revieling the inner nuclear architecture and its involvement in the gene regulation is described by the Simon group [33, 34]. The inner nuclear membrane is connected by the lamin B to the chromatin [35, 36]. This strongly organized lamin-chromatin architecture and its association in the gene regulation suggests specific nucleosome and gene arrangements, e.g. localization in the vicinity to the inner nuclear membrane, are intensively investigated and excellently reviewed by the Cremer groups [37-40].
Here we investigated DU 145 cells transfected with the fusion protein KillerRed-Lamin B being part of such membranes.
Mapping studies of the initial DNA strand breaks in apoptotic Jurkat cells indicated an accumulation of single-strand breaks in vulnerable chromatin regions [41] and confirmed our results, as shown in Figure 4C, and in Figure 5 (right). The inner surface of the nuclear lamina represents such a vulnerable region.
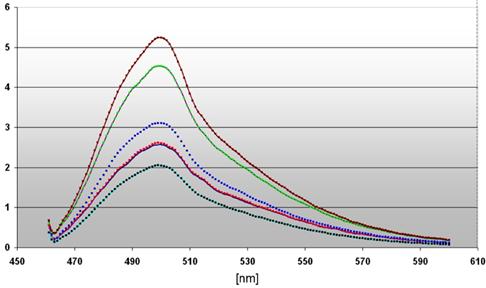
the diagram depicts the different intensities of fluorescence spectra measured in cell nuclei of DU 145 cells stably transfected with pKillerRed-Lamin B1 (0 h  / 60 min
  ) as well as transiently transfected with pH2A-KillerRed (0 h
  / 60 min
  ) after activation with white light (60 min) and subsequent 3' TdT-end labeling of the damaged DNA The curve (
 ) represents the fluorescence spectrum of the transfected but non-activated control. The ordinate gives the scalar fluorescence intensities; the abscissa shows the range of the measured wave lengths [nm]. The fluorescence maximum at 508 nm corresponds to the characteristic emission maximum of the ATTO 465 fluorescence label.
Thus it should be allowed, more as to speculate, that the preferred DNA degradation after ROS damaging occurs internucleosomally, possibly in active, open chromatin regions very close to the nuclear lamina. The DNA degradation products are in size very similar to the products generated by DNase I or micrococcal nuclease [42] during chromatin digestion.
The dependency of the DNA damages on the local distance of the ROS producing site as well as on the illumination time is emphasized in a diagram (Figure 5). We compared the maximal fluorescence of our probes at 508 nm revealing a very strong signal ( ) of the 3' end labeled DNA from nuclei of DU 145 pH2A-KillerRed transfected after illumination during 60 minutes (factor 2.75 related to the control
  ). The identical DNA probe (
 ), but non light activated achieves the factor 2.25, which indicate DNA damaging by the KillerRed-H2A histone fusion protein alone inserted into the nuclear chromatin.
The measured curves of fluorescence intensity of the nuclei derived from stably transfected DU 145 cells with pKillerRed-Lamin B1 result in the factors 1.5 after light activation during 60 minutes ( ) and 1.25 without illumination (related to the control
  ). These data substantiate the different damaging effects on the DNA according to the expression of H2A-KillerRed integrated into the nuclear chromatin or KillerRed-Lamin B1, a component of the nuclear lamina. After activation, the KRED produces toxical ROS against all molecules in the immediate surrounding neighborhood. Targets of the light are in close vicinity of the KRED loacalization (e.g. lamin, e.g. histone). DNA breaks mark the DNA which is nearby these loci and permit their future analysis. The half-life of ROS permits a spatial distance of 10 nm - 20 nm for chemical reaction with the surrounding partners (resulting in marred proteins and strand breaks in nucleic acids) [43-45] underlining the imperative for a delivery of the therapeutic plasmid DNA encoding ROS producing proteins which in turn are targeted to subcellular components, like the nuclear envelope's inner surface or the chromatin.
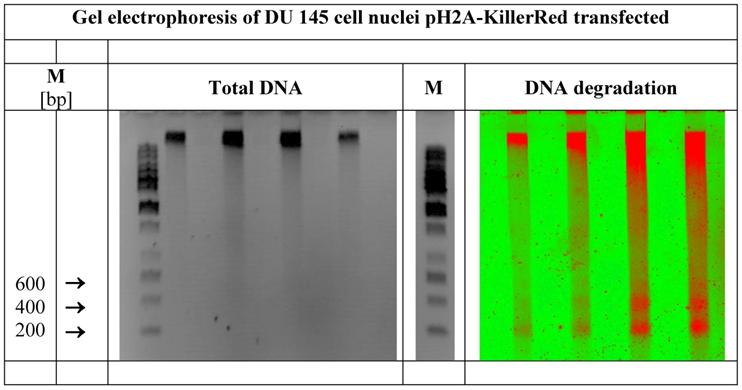
The success of the labeling procedure of the DNA strand breaks was scrutinized by gel electrophoresis in alkaline buffer for detection of single strand breaks.
All DNA 3' end labeling experiments were conducted under identical treatment conditions two fold and with two different fluorochromes: the ATTO 633 as well as the ATTO 465 (Cat.No.: NU-803-465) deriving from the acriflavin dye. This latter ATTO 465 features pH sensitivity and therefore was not qualified for the gel electrophoresis study. The detection of DNA fragments was conducted by two different methods of proof:
Whereas the agarose gel treated with ethidium bromide exhibits bands of the total DNA and the marker positions (left picture of the Figure 6), the identical gel reveals the ROS induced DNA degradation under fluorescence detection conditions (Typhoon™). Defined DNA bands of 200, 400 and (600) bps as prominent degradation products (right picture of the Figure 6) can be detected clearly. The length of 200 bp matches with the DNA size of one nucleosome consisting of the peptide-based histone octamer and of a piece of DNA wound around this octamer with 1.6 turns, as broadly documented [46-48]. The organization of nucleosomal arrays is well reviewed [49-51]
demonstrates the total DNA as well as the defined DNA strand breaks in nuclei of DU 145 human prostate cancer cells expressing pH2A-KillerRed after light-activation with white light. Visualized by gel electrophoresis is the identical DNA probe. In the center of the figure a second DNA marker band is inserted. (M = marker in base pairs)
It is also shown that an internucleosomal DNA cleavage results in a rapid apoptosis triggered by several photosensitizers used in the photo dynamic therapy (PDT) [52]. These findings are not restricted to detect programmed cell death processes in the therapeutic field like PDT..
It should be further considered that, during highly complex aging processes changes in metabolism and immunity are pivotal [53]. Different aging models were comprehensively reviewed by the Taub group as well as by the Beckman & Ames and the de Magalhaes groups [54-58].
Taking the current research's state, it's undisputed that ROS is implicated in many pharmacological processes, biochemical functions and diseases. Their role is ambiguous and ROS can either promote cell evolutionary processes or cell death [59, 60].
Whereas the apoptosis triggering capacity of ROS is broadly documented and considered as accepted [61-66], the correlation of the ROS's originating site and the degree of the DNA's damage caused by the extremely short-lived ROS could be shown here.
With help of our KRED fusion constructs we presumably could contribute to a better understanding of the cellular structure and function mechanisms. In this context the fluorescent proteins absorbing daylight and producing ROS come as tools for research into the increasing field of vision [67-69]
In future we like to mark the broken DNA and to analyse the type and number of genes involved.We also like to analyse the genes present in the periphery of the nuclei in different phases of the cell cycle.
Acknowledgements
We like to thank Prof. Harald Hermann for the gift of Lamin B1-DNA and Prof. Joerg Langowski for generous support.
This publication is dedicated to the retirement of Waldemar Waldeck.
Conflict of Interest
The authors have declared that no conflict of interest exists.
References
1. Boobis AR, Fawthrop DJ, Davies DS. Mechanisms of cell toxicity. Curr Opin Cell Biol. 1990;2:231-7
2. Jimi S, Uchiyama M, Takaki A. et al. Mechanisms of cell death induced by cadmium and arsenic. Ann N Y Acad Sci. 2004;1011:325-31
3. Johansson K, Jarvliden J, Gogvadze V. et al. Multiple roles of microsomal glutathione transferase 1 in cellular protection: A mechanistic study. Free Radic Biol Med. 2010;49(11):1638-45
4. Glickman RD. Phototoxicity to the retina: mechanisms of damage. Int J Toxicol. 2002;21:473-90
5. Natarajan AT, Palitti F. DNA repair and chromosomal alterations. Mutat Res. 2008;657:3-7
6. Gerschman R, Gilbert D, Nye SW. et al. Oxygen poisoning and X-irradiation: a mechanism in common. 1954. Nutrition. 2001;17:162
7. Gerschman R, GILBERT DL, Nye SW. et al. Oxygen poisoning and x-irradiation: a mechanism in common. Science. 1954;119:623-6
8. Harman D. Aging: a theory based on free radical and radiation chemistry. J Gerontol. 1956;11:298-300
9. Promislow DE. DNA repair and the evolution of longevity: a critical analysis. J Theor Biol. 1994;170:291-300
10. de BJ, Andressoo JO, de WJ. et al. Premature aging in mice deficient in DNA repair and transcription. Science. 2002;296:1276-9
11. de Magalhaes JP. Human disease-associated mitochondrial mutations fixed in nonhuman primates. J Mol Evol. 2005;61:491-7
12. DiMauro S, Schon EA. Mitochondrial respiratory-chain diseases. N Engl J Med. 2003;348:2656-68
13. Jazwinski SM. Yeast longevity and aging--the mitochondrial connection. Mech Ageing Dev. 2005;126:243-8
14. Rasmussen UF, Krustrup P, Kjaer M. et al. Experimental evidence against the mitochondrial theory of aging. A study of isolated human skeletal muscle mitochondria. Exp Gerontol. 2003;38:877-86
15. Wallace DC. Mitochondrial genetics: a paradigm for aging and degenerative diseases? Science. 1992;256:628-32
16. Mueller G, Waldeck W, Braun K. From green to red--To more dead? Autofluorescent proteins as photosensitizers. J Photochem Photobiol B. 2010;98:95-8
17. Waldeck W, Mueller G, Wiessler M. et al. Autofluorescent proteins as photosensitizer in eukaryontes. Int J Med Sci. 2009;6:365-73
18. Bulina ME, Chudakov DM, Britanova OV. et al. A genetically encoded photosensitizer. Nat Biotechnol. 2006;24:95-9
19. Stone KR, Mickey DD, Wunderli H. et al. Isolation of a human prostate carcinoma cell line (DU 145). Int J Cancer. 1978;21:274-81
20. Donawho CK, Luo Y, Luo Y. et al. ABT-888, an orally active poly(ADP-ribose) polymerase inhibitor that potentiates DNA-damaging agents in preclinical tumor models. Clin Cancer Res. 2007;13:2728-37
21. Chatterjee S, Berger SJ, Berger NA. Poly(ADP-ribose)polymerase: A guardian of the genome that facilitates DNA repair by protecting against DNA recombination. Mol Cell Biochem. 1999;193:23-30
22. Dantzer F, Schreiber V, Niedergang C. et al. Involvement of poly(ADP-ribose) polymerase in base excision repair. Biochimie. 1999;81:69-75
23. Herceg Z, Wang ZQ. Functions of poly(ADP-ribose) polymerase (PARP) in DNA repair, genomic integrity and cell death. Mutat Res Fundam Mol Mech Mut. 2001;477:97-110
24. Burkle A. Poly(APD-ribosyl)ation, a DNA damage-driven protein modification and regulator of genomic instability. Cancer Lett. 2001;163:1-5
25. Schlicker A, Peschke P, Burkle A. et al. 4-Amino-1,8-naphthalimide: a novel inhibitor of poly(ADP-ribose) polymerase and radiation sensitizer. Int J Radiat Biol. 1999;75:91-100
26. Tentori L, Portarena I, Graziani G. Potential clinical applications of poly(ADP-ribose) polymerase (PARP) inhibitors. Pharmacol Res. 2002;45:73-85
27. Koh SH, Park Y, Song CW. et al. The effect of PARP inhibitor on ischaemic cell death, its related inflammation and survival signals. European Journal of Neuroscience. 2004;20:1461-72
28. Darzynkiewicz Z, Traganos F, Wlodkowic D. Impaired DNA damage response--an Achilles' heel sensitizing cancer to chemotherapy and radiotherapy. Eur J Pharmacol. 2009;625:143-50
29. Wood RD, Mitchell M, Lindahl T. Human DNA repair genes, 2005. Mutat Res. 2005;577:275-83
30. Pelicano H, Carney D, Huang P. ROS stress in cancer cells and therapeutic implications. Drug Resist Updat. 2004;7:97-110
31. Bulina ME, Lukyanov KA, Britanova OV. et al. Chromophore-assisted light inactivation (CALI) using the phototoxic fluorescent protein KillerRed. Nat Protoc. 2006;1:947-53
32. Usachenko SI, Bradbury EM. Histone-DNA contacts in structure/function relationships of nucleosomes as revealed by crosslinking. Genetica. 1999;106:103-15
33. Shaklai S, Amariglio N, Rechavi G. et al. Gene silencing at the nuclear periphery. FEBS J. 2007;274:1383-92
34. Somech R, Shaklai S, Amariglio N. et al. Nuclear envelopathies--raising the nuclear veil. Pediatr Res. 2005;57:8R-15R
35. Goldberg M, Harel A, Gruenbaum Y. The nuclear lamina: molecular organization and interaction with chromatin. Crit Rev Eukaryot Gene Expr. 1999;9:285-93
36. Gotzmann J, Foisner R. Lamins and lamin-binding proteins in functional chromatin organization. Crit Rev Eukaryot Gene Expr. 1999;9:257-65
37. Cremer T, Cremer M, Dietzel S. et al. Chromosome territories--a functional nuclear landscape. Curr Opin Cell Biol. 2006;18:307-16
38. Tanabe H, Muller S, Neusser M. et al. Evolutionary conservation of chromosome territory arrangements in cell nuclei from higher primates. Proc Natl Acad Sci U S A. 2002;99:4424-9
39. Albiez H, Cremer M, Tiberi C. et al. Chromatin domains and the interchromatin compartment form structurally defined and functionally interacting nuclear networks. Chromosome Res. 2006;14:707-33
40. Rouquette J, Cremer C, Cremer T. et al. Functional nuclear architecture studied by microscopy: present and future. Int Rev Cell Mol Biol. 2010;282:1-90
41. Liu QY, Ribecco-Lutkiewicz M, Carson C. et al. Mapping the initial DNA breaks in apoptotic Jurkat cells using ligation-mediated PCR. Cell Death Differ. 2003;10:278-89
42. Oliveri M, Daga A, Cantoni C. et al. DNase I mediates internucleosomal DNA degradation in human cells undergoing drug-induced apoptosis. Eur J Immunol. 2001;31:743-51
43. Zheng Y, Sheppard TL. Half-life and DNA strand scission products of 2-deoxyribonolactone oxidative DNA damage lesions. Chem Res Toxicol. 2004;17:197-207
44. Martini M, Termini J. Peroxy radical oxidation of thymidine. Chem Res Toxicol. 1997;10:234-41
45. Pandey KB, Mehdi MM, Maurya PK. et al. Plasma protein oxidation and its correlation with antioxidant potential during human aging. Dis Markers. 2010;29:31-6
46. Thomas JO. Histone H1: location and role. Curr Opin Cell Biol. 1999;11:312-7
47. Woodcock CL, Ghosh RP. Chromatin higher-order structure and dynamics. Cold Spring Harb Perspect Biol. 2010;2:a000596
48. Radman-Livaja M, Rando OJ. Nucleosome positioning: how is it established, and why does it matter? Dev Biol. 2010;339:258-66
49. Bussiek M, Muller G, Waldeck W. et al. Organisation of nucleosomal arrays reconstituted with repetitive African green monkey alpha-satellite DNA as analysed by atomic force microscopy. Eur Biophys J. 2007;37:81-93
50. Woodcock CL. Chromatin architecture. Curr Opin Struct Biol. 2006;16:213-20
51. Fletcher TM, Hansen JC. The nucleosomal array: structure/function relationships. Crit Rev Eukaryot Gene Expr. 1996;6:149-88
52. Luo Y, Chang CK, Kessel D. Rapid initiation of apoptosis by photodynamic therapy. Photochem Photobiol. 1996;63:528-34
53. Taub DD, Murphy WJ, Longo DL. Rejuvenation of the aging thymus: growth hormone-mediated and ghrelin-mediated signaling pathways. Curr Opin Pharmacol. 2010;10:408-24
54. Beckman KB, Ames BN. Oxidative decay of DNA. J Biol Chem. 1997;272:19633-6
55. Beckman KB, Ames BN. The free radical theory of aging matures. Physiol Rev. 1998;78:547-81
56. Beckman KB, Ames BN. Mitochondrial aging: open questions. Ann N Y Acad Sci. 1998;854:118-27
57. de Magalhaes JP, Church GM. Cells discover fire: employing reactive oxygen species in development and consequences for aging. Exp Gerontol. 2006;41:1-10
58. Cevenini E, Bellavista E, Tieri P. et al. Systems biology and longevity: an emerging approach to identify innovative anti-aging targets and strategies. Curr Pharm Des. 2010;16:802-13
59. Davies KJ. An overview of oxidative stress. IUBMB Life. 2000;50:241-4
60. Voeikov VL. Reactive oxygen species--(ROS) pathogens or sources of vital energy? Part 1. ROS in normal and pathologic physiology of living systems. J Altern Complement Med. 2006;12:111-8
61. Kujoth GC, Hiona A, Pugh TD. et al. Mitochondrial DNA mutations, oxidative stress, and apoptosis in mammalian aging. Science. 2005;309:481-4
62. Wood KA, Youle RJ. Apoptosis and free radicals. Ann N Y Acad Sci. 1994;738:400-7
63. Inoue M, Sato EF, Nishikawa M. et al. Free radical theory of apoptosis and metamorphosis. Redox Rep. 2004;9:237-47
64. Ott M, Gogvadze V, Orrenius S. et al. Mitochondria, oxidative stress and cell death. Apoptosis. 2007;12:913-22
65. Raha S, Robinson BH. Mitochondria, oxygen free radicals, and apoptosis. Am J Med Genet. 2001;106:62-70
66. Circu ML, Aw TY. Reactive oxygen species, cellular redox systems, and apoptosis. Free Radic Biol Med. 2010;48:749-62
67. Jimenez-Banzo A, Nonell S, Hofkens J. et al. Singlet oxygen photosensitization by EGFP and its chromophore HBDI. Biophys J. 2008;94:168-72
68. Greenbaum L, Rothmann C, Lavie R. et al. Green fluorescent protein photobleaching: a model for protein damage by endogenous and exogenous singlet oxygen. Biol Chem. 2000;381:1251-8
69. Muller-Taubenberger A, Anderson KI. Recent advances using green and red fluorescent protein variants. Appl Microbiol Biotechnol. 2007;77:1-12
Author contact
![]() Corresponding author: Dr. Klaus Braun, German Cancer Research Center (DKFZ), Dept. of Medical Physics in Radiology, Im Neuenheimer Feld 280, D-69120 Heidelberg, Germany. Phone: +49 6221-42 2495; Fax: +49 6221-42 3326; e-mail: k.braunde
Corresponding author: Dr. Klaus Braun, German Cancer Research Center (DKFZ), Dept. of Medical Physics in Radiology, Im Neuenheimer Feld 280, D-69120 Heidelberg, Germany. Phone: +49 6221-42 2495; Fax: +49 6221-42 3326; e-mail: k.braunde