Impact Factor ISSN: 1449-1907
- Issue 8; 2026
- Issue 7; 2026
- Issue 6; 2026
- Issue 5; 2026
- Issue 4; 2026
- Volume 23; 2026
- Past Issues
- Editorial Board
- Cover Images
- Index & Coverage
- Cover Suggestion
- Special Issues
INTRODUCTION
METHODS AND MATERIALS
RESULTS
DISCUSSION
References
APPENDIX – A. Biologically...
APPENDIX – B. Biologically...

 Global reach, higher impact
Int J Med Sci 2008; 5(1):41-49. doi:10.7150/ijms.5.41 This issue Cite
Research Paper
Qualitative Dosimetric and Radiobiological Evaluation of High – Dose – Rate Interstitial brachytherapy Implants
Than S. Kehwar1, Syed F. Akber2, Kamlesh Passi 3 ![]()
1. Department of Radiation Oncology, University of Pittsburgh Cancer Institute, Pittsburgh, PA, USA.
2. Department of Radiation Oncology, Case Western Reserve University, Cleveland, OH, USA
3. Department of Radiation Oncology, MD Oswal Memorial Cancer treatment and Research Center, Ludhiana (Pb), India.
Received 2007-9-3; Accepted 2008-2-16; Published 2008-2-19
Abstract
Radiation quality indices (QI), tumor control probability (TCP), and normal tissue complication probability(NTCP) were evaluated for ideal single and double plane HDR interstitial implants. In the analysis, geometrically–optimized at volume (GOV) treatment plans were generated for different values of inter–source–spacing (ISS) within the catheter, inter–catheter–spacing (ICS), and inter–plane–spacing (IPS) for single - and double - plane implants. The dose volume histograms (DVH) were generated for each plan, and the coverage volumes of 100%, 150%, and 200% were obtained to calculate QIs, TCP, and NTCP. Formulae for biologically effective equivalent uniform dose (BEEUD), for tumor and normal tissues, were derived to calculate TCP and NTCP. Optimal values of QIs, except external volume index (EI), and TCP were obtained at ISS = 1.0 cm, and ICS = 1.0 cm, for single–plane implants, and ISS = 1.0 cm, ICS = 1.0 cm, and IPS = 0.75 to 1.25 cm, for double – plane implants. From this study, it is assessed that ISS = 1.0 cm, ICS = 1.0 cm, for single - plane implant and IPS between 0.75 cm to 1.25 cm provide better dose conformity and uniformity.
Keywords: HDR interstitial implants, quality indices, inter-source-spacing, inter-catheter-spacing, geometrical – optimization at volume, biologically effective equivalent uniform dose.
INTRODUCTION
Use of computerized, remote controlled, high-dose-rate (HDR) brachytherapy units, and treatment planning systems provide conformal dose coverage to the target volume and minimum possible dose to surrounding normal tissues / critical organs. However, the basic principles of dosimetry systems [1 - 4] still influence the criteria of the source placement (activity distribution) and dose distributions in brachytherapy applications. In the HDR brachytherapy applications, such as in the treatment of carcinoma of the cervix (Ca.Cx.), the basic rules of the Manchester system [1] are still followed in many clinics World wide. In the HDR interstitial brachytherapy (ISBT) implants none of the classical dosimetry system [1 - 4] is followed. This is because modern HDR units have a high activity miniature type single stepping source, which offers an advantage of varying source positions (dwell positions) and time (dwell time) to a particular dwell position to obtain an appropriate dose distribution and isodose geometry. For HDR implants, a new dosimetry system, known as stepping source dosimetry system (SSDS) [5], has been devised in which source and dose distribution rules were formed using the selected basic rules of the Paris and the Manchester dosimetry systems with some modifications.
Kwan et al [6] have done a computerized dosimetric study to determine optimal source and ribbon separation for single – plane implants, and the ribbon and plane separation of for double plane implants were studied with respect to the dose homogeneity, for single – and double – plane iridium – 192 (Ir – 192) implants. In another study of Quimby type breast implants, interplanar spacing, based on the implant sizes, was studied [7]. None of the study has so far able to optimize these parameter for HDR single – and double – plane implants. In this work, we performed a computerized dosimetric study of HDR implants to find out optimal values of inter – source – spacing (ISS), within the catheter, and inter – catheter – spacing (ICS), within the target volume (TV), for ideal single plane implants. This was done by computing various radiation quality indices (QI) for geometrically optimized at volume (GOV) treatment plans. The GOV mode of optimization was chosen due to its simplicity, otherwise reader can choose any other suitable mode of optimization in practice. The inter – plane – spacing (IPS) for ideal double plane implants has also been determined using optimal values of ISS and ICS, obtained from single plane implants, by computing above said QIs for GOV treatment plans. The concept of Biologically Effective Equivalent Uniform Dose (BEEUD) has been introduced to calculate the tumor control probability (TCP) [8, 9] and normal tissue complications probability (NTCP) [10] for these HDR plans.
METHODS AND MATERIALS
Dosimetric parameters
To investigate ideal values of ISS, ICS and IPS in HDR interstitial implants, for which nearly ideal dose distribution within the target volume and maximum sparing of the surrounding normal tissues / organs, can be achieved, a quantitative analysis of ideal single and double plane implants has been done for different ISS and ICS values. The analysis is performed by computing and comparing different QIs, TCP, and NTCP for GOV treatment plans of these implants. The quality indices used in this study are: the coverage index (CI), the external volume index (EI), the relative dose homogeneity index (DHI), the overdose index (ODI), and the dose non-uniformity ratio (DNR), and are defined as:
1. Coverage Index (CI): The fraction of the target volume that receives a dose equal to or greater than the reference dose [11].
CI = TVDref /TV (1)
2. External Volume Index (EI): The ratio of the volume of normal tissue that receives a dose equal to or greater than the reference dose to the volume of the target [11].
EI = NTVDref /TV (2)
3. Relative Dose Homogeneity Index (DHI): This is defined as the ratio of the target volume which receives a dose in the range of 1.0 to 1.5 times of the reference dose to the volume of the target that receives a dose equal to or greater than the reference dose [11].
DHI = [TVDref – TV1.5Dref]/TVDref (3)
4. Overdose Volume Index (ODI): This is the ratio of the target volume which receives a dose equal to or more than 2.0 times of the reference dose to the volume of the target that receives a dose equal to or greater than the reference dose [11].
ODI = TV2.0Dref /TVDref (4)
5. Dose Non-uniformity Ratio (DNR): This is the ratio of the target volume which receives a dose equal to or greater than 1.5 times of the reference dose to the volume of the target which receives a dose equal to or greater than the reference dose [12].
DNR = TV1.5Dref /TVDref (5)
Conditions for an ideal implant are where the values of QIs should be as follows
CI = 1, EI = 0, DHI = 1, ODI = 0, and DNR = 0
To compute above defined QIs, for single plane implants, ideal targets of target volumes of the dimensions of Length (L= 6.0 cm) × Width (W= 5.0 cm ) × Thickness (T = 1.0 cm) have been taken into account. While changing the values of ISS and / or ICS, sometimes extra length and width of target volume were also added to keep constant distance between target surface and peripheral dwell positions and / or target surface and peripheral catheters. The catheters and peripheral dwell positions were placed within 0.5 cm of the boundary of the target volume. Treatment plans were generated using PLATO (Nucletron BV, Veenendaal, The Netherlands) 3 – D treatment planning system. The dose points were placed on the surface of the target volume relative to the active dwell positions. All the dose points, in the implant, were used for dose normalization for the total dose of 42 Gy with 3.5 Gy per fraction. The Cumulative DVH (cDVH) for GOV treatment plans were generated for different values of ISS and ICS. The values of ICS vary from 0.5 cm to 2.0 cm, in steps of 0.25 cm. For each ICS values, the ISS varies from 0.25 cm to 2.0 cm in steps of 0.25 cm. In each treatment plan, the isodose surfaces of 100% (42 Gy), 150% (63 Gy) and 200% (84 Gy) were generated to find out the respective dose coverage volumes. By comparing the QIs for all treatment plans, the optimal values of ISS and ICS were obtained for which QIs to be the closest values of that of an ideal implant.
The GOV treatment plans were also generated for double plane implants using optimal values of ISS and ICS, obtained from single plane implants QI analysis. The cDVHs were generated for inter – plane –spacing (IPS) vary from 0.5 cm to 2.0 cm in steps of 0.25 cm and the coverage volumes for the isodose surfaces of 100%, 150% and 200% were obtained from the cDVHs, as calculated for single plan implants, to compute the above said QIs for each treatment plan with different IPS value.
Radiobiological models
The linear quadratic (LQ) model provides a simple way to describe dose – response of different fractionation schemes, in terms of the Biologically Effective Dose (BED) [13]. The BED for HDR ISBT [9] for a total dose of D (Gy) delivered with dose d (Gy) per fraction can be written by
BED = D[1 + G d/(α/ß)] (6)
Where α/ß ratio is the tissue specific parameter and is the ratio of the coefficients of lethal damage to the sublethal damage, and G is the factor accounting for incomplete repair of sublethal damage during interfraction interval between the fractions. In this study, it is assumed that the time interval between the fractions is sufficient enough to allow the full repair of the sublethal damage, hence G is taken as 1.
The tumor control probability (TCP) [8, 9] for uniform dose distribution within the target volume is given by
TCP = exp[ - ρ V exp(-α BEDt)] (7)
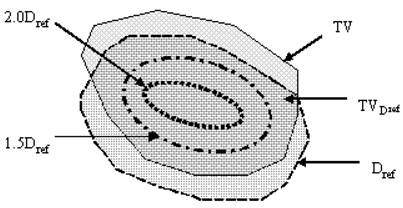
Where ρ, V, α, and BEDt are the clonogenic cell density, target volume, coefficient of lethal damage (radio – sensitivity of lethal damage), and BED for the target, respectively. The dose distribution of HDR ISBT within target volume is highly non – uniform and has high dose gradient, hence equation (7) can not be directly applied to compute accurate TCP. Hence, to get an appropriate expression of TCP for HDR ISBT implant different regions of HDR ISBT implant have been considered (Figure 1). It is also shown that target volume is divided into four regions which are (1) the region which receives a dose less than the reference dose, (2) the region which receives a dose in the range of 1.0 to 1.5 times of the reference dose, (3) the region which receives a dose in the range of 1.5 to 2.0 times of the reference dose, and (4) the region which receives a dose equal to or more than 2.0 times of the reference dose. Each region of target volume has its own BEEUD. The expression of BEEUD, for tumor, is derived in Apendix – A, where it is considered that there is a non – uniform dose distribution within the target volume. The target volume is divided into 'n' number of voxels of small enough volume. So it can be assumed that the dose distribution within the voxel is uniform. The expression for BEEUD, given in equation (e) of Appendix – A, is written as
Schematic diagram showing target volume (TV), portion of target volume (TVDref) that receives dose equal to or more than the reference dose Dref, the isodose surface that receives 1.5 time of the reference dose (1.5 Dref), and that receives 2.0 times of the reference dose (2.0 Dref).
BEEUDt = -(1/α) ln[(1/V) Σivi exp{ - α BEDti}] (8)
Where V is the target volume, vi is the volume of ith voxel of the target volume, and BEDti is the BED of the ith voxel of the target volume. The subscript 't' denotes the target volume. With the use of BEEUD of each region, shown in Figure 1, the TCP may be written as
TCP = TCP1 × TCP2 × TCP3 × TCP4 (9)
Where the terms TCP1, TCP2, TCP3, and TCP4 are the TCPs of above defined regions of the target volume, respectively. The expressions of these terms are given as follows
1. The TCP for the region of target volume which receives a dose less than the reference dose
TCP1 = exp[ - ρ (TV – TVDref) exp( - α BEEUDt1)]
By rearranging and using the value of equation (1), we may write
TCP1 = exp[ - ρ TVDref{(1 – CI)/CI} exp( - α BEEUDt1)] (9a)
2. The TCP for the region of target volume that receives a dose in the range of 1.0 to 1.5 times of the reference dose
TCP2 = exp[ - ρ (TVDref – TV1.5Dref) exp( - α BEEUDt2)]
Using the value of equation (3), we may write
TCP2 = exp[ - ρ TVDref . DHI exp( - α BEEUDt2)] (9b)
3. The TCP for the region of target volume that receives a dose in the range of 1.5 to 2.0 times of the reference dose
TCP3 = exp[ - ρ (TV1.5Dref – TV2Dref) exp( - α BEEUDt3)]
By rearranging and using the values of equations (4) & (5), we may write
TCP3 = exp[ - ρ TVDref (DNR– ODI) exp( - α BEEUDt3)] (9c)
4. The TCP for the region of target volume that receives a dose equal to or greater than 2 times of the reference dose
TCP4 = exp[ - ρ TV2Dref exp( - α BEEUDt4)]
By using the value of equation (4), we may have the form of TCP4
TCP4 = exp[ - ρ TVDref .ODI exp( - α BEEUDt4)] (9d)
Now multiplying and rearranging equations 9(a) – 9(d), the expression of net TCP may be given by
TCP = exp[–ρ TVDref {({1–CI}/CI) exp(–α BEEUDt1)+DHI exp(–α BEEUDt2) +(DNR– ODI) exp(–α BEEUDt3)+ODI exp(–α BEEUDt4)}] (10)
Probably three radiobiological parameters, considered in the TCP formulation, such as clonogenic cell density (ρ), radio-sensitivity (α), and cell proliferation rate (Tp) influence the TCP phenomenological and are voxel dependent. In this work, it is assumed that first two parameters are constant throughout the target volume and influence of the cell proliferation rate is negligible.
The radiobiologically based expression of normal tissue complication probability (NTCP) for uniform dose distribution within normal tissue / organ, was initially proposed by Kallman, et al [14] and was modified by Zaider and Amols [15]. Kehwar and Sharma [16] and Kehwar [10] have further extended this model for the multiple component (MC) and the linear quadratic (LQ) models, respectively. These extended forms, of the NTCP model for MC and LQ models, were fitted to the normal tissue tolerance doses reported by Emami et al [17] at TD5/5 and TD50/5 for partial volumes of different normal tissues / organs. Kehwar's [10] NTCP equation of LQ model may be written as
NTCP = exp[– N0 v– k exp(– α BEDn)] (11)
Where v and BEDn are the fractional partial volume (v=V/V0, here V and V0 are the partial volume and the reference volume of the normal tissue / organ, respectively) and BED of normal tissue / organ. The N0 and k are tissue-specific, non-negative adjustable parameters. The dose distribution outside the target volume within the adjacent normal tissue is highly non-uniform, hence equation (11) can not be applied to calculate NTCP for such a high dose gradient. For the purpose, entire volume of the normal tissue / organ is divided into two regions, viz (1) the region that receives a dose less than the reference dose, and (2) the region that receives a dose equal to or greater than the reference dose. Each region of normal tissue has its own BEEUD. The expression of BEEUD for normal tissue is derived in Apendix – B, where it is considered that there is a non-uniform dose distribution within the normal tissue, and is divided into 'n' number of very-very small sub-volumes (voxels). It has also been assumed that the dose distribution within a sub-volume is uniform. From equation (11), it is seen that the equation of NTCP is not an additive term of the volume, as TCP for TV, so the NTCP of voxels can not provide net NTCP of entire normal tissue. Therefore, equation (11) has been modified to account for addition of the volumes of the voxels, and the new term is known as the NTCP factor (NTCPF) which is written as
NTCPF = exp[(N0)-1/k Σi{(Vi/V0) exp[(α/k) BEDni]}] (12)
Where V0 is the reference volume of the normal tissue / organ and Vi is the volume of ith voxel in the normal tissue / organ. The expression of BEEUD, from Appendix – B, for normal tissue is written by
BEEUDn = (k/α) ln[Σi{(Vi/V0) exp[(α/k) BEDni]}] (13)
With the use of BEEUD of each region of normal tissue / organ, the NTCPF may be written as
NTCPF = NTCPFn1 × NTCPFn2 (14)
Where the terms NTCPFn1, and NTCPFn2 are the NTCPFs of above defined two normal tissue regions, respectively. The expressions of these terms are given as follows
1. The NTCPF for the region of normal tissue / organ which receives a dose less than the reference dose
NTCPFn1 = exp[(N0)–1/k(1/V0) (V – NTVDref) exp{(α/k) BEEUDn1}]
Where, V, is the normal tissue volume of the normal tissue / organ. By rearranging and using the value of equation (2), we may write
NTCPFn1 = exp[(N0)–1/k(TV/V0) (V/TV – EI) exp{(α/k) BEEUDn1}] (14a)
2. The NTCPF for the region of normal tissue / organ that receives a dose equal to or greater than the reference dose
NTCPFn2 = exp[(N0)–1/k(1/V0) (NTVDref) exp{(α/k)BEEUDn2}]
Using the value of equation (3), we may write
NTCPFn2 = exp[(N0)–1/k(TV.EI/V0) exp{(α/k)BEEUDn2}] (14b)
By adding and rearranging equations (14a) and (14b), the net NTCPF will be written as
NTCPF = exp[(N0)–1/k(TV/V0)[(V/TV–EI) exp{(α/k)BEEUDn1}+(EI/V0) exp{(α/k)BEEUDn2}]] (15)
The net NTCP from equation (15) is written by
NTCP = (NTCPF)k (16)
For statistical comparison, two tail unpaired t-student test is employed to the results of NO and GOV plans.
RESULTS
Dosimetric Analysis
a) Single Plane Implant
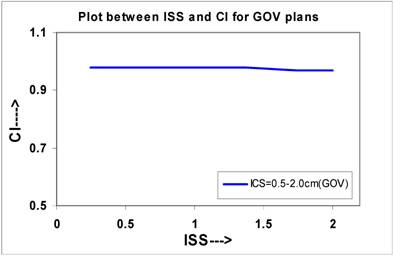
The curves were plotted for single plane implants between ISS and IQs, which are shown in Figures 2 to Figure 6. Figure 2 shows that the CI decreases from 0.98 to 0.97 for the values of ISS, which may be considered almost constant. The slope of the linear lines is -0.006 for all ICS values. The CI at ISS = 1.0 cm and ICS = 1.0 cm are 0.98 these plans.
A quantitative comparison of CI calculated for varying ISS and ICS values for NO and GOV plans for ideal HDR single plane interstitial implants.
Comparison of calculated DNR for varying ISS and ICS for GOV plans, of ideal HDR single plane interstitial implants.
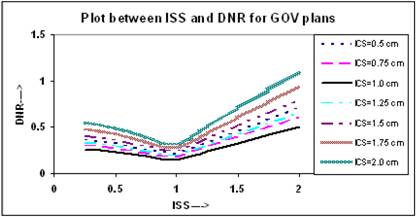
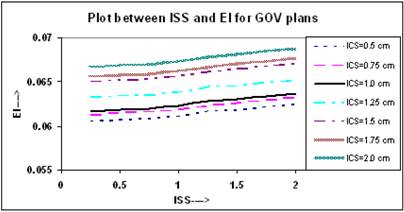
Figure 3 shows that the value of EI increases in a linear trend insignificantly for all ICS values, and for any value of ISS. In these plans, the slopes of all linear lines remain almost constant with an average of 0.0012 (0.0012, 0.0013).
Comparison of calculated EI for varying ISS and ICS for GOV plans, of ideal HDR single plane interstitial implants.
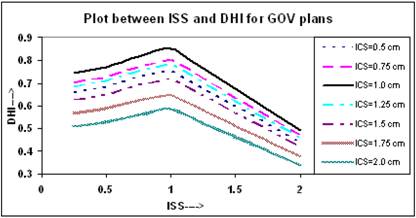
It is clear from Figure 4 that initially the value of DHI increases with increasing ISS and ICS and reaches to a maximum value at ISS = 1.0 cm and ICS = 1.0 cm, and then decreases with ISS. The values of DHI at ISS = 1.0 cm and ICS = 1.0 cm are 0.851 for these plans.
Comparison of calculated DHI for varying ISS and ICS for GOV plans, of ideal HDR single plane interstitial implants.
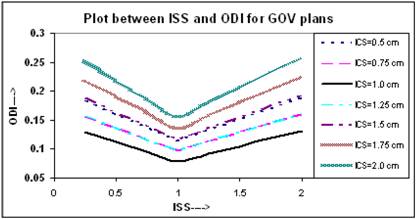
The relation between ODI and ISS for different ICS values is given in Figure 5. It appears that the value of ODI decreases with increasing ISS and ICS and reaches to a minimum at ISS = 1.0 cm & ICS = 1.0 cm, thereafter it starts increasing with ISS and ICS. The values of ODI at ISS = 1.0 cm and ICS = 1.0 cm are 0.079 for these plans. Figure 6 shows similar relation between DNR and ISS as between ODI and ISS.
Comparison of calculated ODI for varying ISS and ICS for GOV plans, of ideal HDR single plane interstitial implants.
The calculated QIs for an ideal HDR implant reveals that at ISS = 1.0 cm and ICS = 1.0 cm, the values of DHI, ODI and DNR attain an optimal level. In this study, the values of QIs for single - plane implant at ISS =1.0 cm and ICS = 1.0 cm are CI = 0.98; EI = 0.062; DHI = 0.851; ODI = 0.079, and DNR = 0.149, respectively.
b) Double Plane Implant
For simplicity of the study, the best suitable values of ISS and ICS (ISS = 1.0 cm & ICS = 1.0 cm) for which DHI, ODI and DNR attain optimal values in single - plane implants, were used to construct the double plane implant. These values of ISS and ICS may not be optimal for double plane implants. The implant length and width were kept constant while the interplane separation (IPS) allowed to vary from 0.5 cm to 2.0 cm in steps of 0.25 cm. The GOV plans were generated for each IPS and to find out the volume coverage for 100%, 150% and 200% isodose surfaces the DVHs were generated. From above determined volumes, the QIs were computed and found that the variation of QIs with IPS is similar to that as of IQs with ISS. For IPS = 0.75 cm to 1.25 cm the QIs are optimal to treat a target of thickness from 1.75 to 2.25 cm. The values of QIs for IPS = 1.0 cm are CI = 0.978, EI = 0.08, DHI = 0.88, ODI = 0.09 and DNR = 0.29. If the IPS is further increased beyond 1.25 cm the DHI decreases and ODI increases, and a cold spot is generated between the two planes.
Plots between QIs and IPS, for both type of plans, were similar to that for single plan implants, hence to avoid repetition of the figures, we have not included in this paper.
Radiobiological Analysis
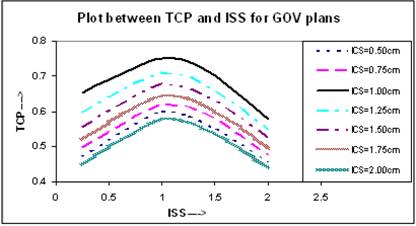
BEEUDs have been calculated using equation (8) for different portions of the TV with the use of α/β = 10 Gy, α = 0.35 Gy-1 [13], and clonogenic cell density ρ = 107 [18] to calculate the net value of TCP using equation (10) for entire TV. In the calculation of BEEUD, for a particular region of the TV, the volume of that region is subdivided into very small sub-volumes and it is assumed that there is a uniform dose distribution within each sub-volume. The plots between net TCPs and ISS are shown in Figure 7, where the TCP for ICS = 1.0 cm and ISS = 1.0 cm implant is higher compared to other ICS and ISS settings.
Comparison of calculated TCP, based on LQ equation, for varying ISS and ICS for GOV plans, of ideal HDR single plane interstitial implants.
To calculate the NTCP for normal tissue, the normal tissue / organ is divided into two regions, (i) the region that receives a dose less than the reference dose, and (ii) the region that receives a dose equal to or greater than the reference dose. For demonstration purpose and to simulate the lung complications in breast HDR implants, the BEEUDs values were calculated for each region of the normal tissue / organ using derived values of the parameters [10], N0 = 3.93, k =1.03, for combined set of lung tolerance data, and α = 0.075 Gy-1, for lung tolerance data of Emami et al [17] and published values of α/β = 6.9 Gy [19, 20]. The plots of NTCP and ISS for different ICS setting are shown in Figure 8, where it is seen that the value of NTCP increases with increasing ICS and ISS and highest value was found at ICS = 2.0 cm and ISS = 2.0 cm. Similar results were obtained for double plan implants, but to avoid repetition, the figures have not been included.
Comparison of calculated NTCP, based on LQ equation, for varying ISS and ICS GOV plans, of ideal HDR single plane interstitial implants.

DISCUSSION
A number of quality indices have been proposed to evaluate LDR and HDR interstitial implants, such as, DHI and DNR proposed by Saw and Suntharalingam [21, 22] and Saw et al [12] for LDR interstitial brachytherapy and was adopted by Meertens et al [11] for the evaluation of HDR interstitial implants. Hence, in this study we used the QI values as defined by Meertens et al [11].
The expressions for TCP and NTCP incorporating above defined QIs were derived in this work, and the effects of the variation in ISS and ICS were investigated in GOV plans of ideal HDR interstitial implants. Figures – 7 and 8 show the effect of variation in ISS and ICS on TCP and NTCP. The calculations of TCP and NTCP, done by most of the investigators [8, 9, 10, 14, 15, 16], based on either entire target or normal tissue volume with a single dose or by dividing the entire volume in small voxels. In this work, we have opted different approach, where TV and NTV are divided into 4 and 2 parts to define target and normal tissue related QIs, respectively. The expressions of BEEUD were derived for these parts of TV and NTV, and were incorporated into the expression of the TCP and NTCP.
In the Paris dosimetry system, designed for Ir – 192 wires and ribbons, suggests that to obtain a better coverage of the TV, one have to increase the active length of the catheters, and peripheral catheters have to be placed outside the target volume. But by doing so, this also increases the EI which consequently will increase the NTCP. Many researchers investigated this aspect and stated that active length of the catheters can be reduced compared to non optimized plans with uniform dwell times [5, 23, 24, 25] by properly optimizing the implant, because in optimization the dwell times of the dwell positions at the ends of the catheters and peripheral catheters are increased to compensate for the lack of source locations beyond the outermost dwell positions.
Kwan et al [6] have reported that with respect to the dose homogeneity, within the implants, the optimal source and ribbon separation for single – plane implants was found to be 1.0 cm, and the ribbon and plane separation of 1.5 cm was found for double plane implants, maintaining a 1.0 cm source separation. Zwicker et al [7] found that interplanar spacing in Quimby type breast implants was implant size dependent.
Major et al [26] have studied the effect of source step size and catheter separation on DNR for non-optimized and optimized interstitial breast HDR implants. In their study, the lowest value of DNR is reported for 10 mm source step size. The effect of catheter separation is studied at 5 mm source step size. The catheter separation was increased from 10 to 20 mm, for which the value of DNR reported to be increased from 0.15 to 0.22. While in the present study, QIs were evaluated for the above mentioned values of ISS and ICS and lowest DNR is found at ISS = 1.0 cm and ICS = 1.0 cm, where ISS =1.0 cm is same as 10 mm source step size.
From the results of the present study, it can be concluded that in HDR ISBT implants the GOV provides an optimum outcome with regard to afore mentioned QIs, TCP, and NTCP, and is best achieved nearly uniform dose distribution within the implanted volume. While HDR ISBT implants done using classical dosimetry systems or non- optimization process lead to unsatisfactory results. It is also seen that on the basis of CI, EI and NTCP plots, no conclusion can be drawn as to what values of ICS and ISS (and IPS) would be used to optimize the single and double plane HDR implants. While DHI, ODI, DNR and TCP clearly reveal that their optimal values are at ICS = 1.0 cm and ISS = 1.0 cm, for single plane implant and ICS = 1.0 cm, ISS = 1.0 cm, and IPS = 0.75 to 1.25 cm, for double plane implants as shown in the study.
CONFLICT OF INTEREST
The authors have declared that no conflict of interest exists.
References
1. Peterson R, Parker HM. Dosage system for gamma-ray therapy. Br J Radiol. 1934;7:592- 632
2. Quimby EH. The grouping of radium tubes in packs and plagues to produce the desired distribution of radiation. Am J Roentgenol. 1932;27:18
3. Quimby EH. The development of dosimetry in radium therapy. In: (ed.) Hilaris BS. Afterloading: 20 Years of Experience, 1955 - 1975; Proceedings of the 2nd International Symposium on Radiation Therapy. New York: Memorial Sloan-Kettering Cancer Center. 1975:1-6
4. Pierquin B, Dutreix A, Paine CH. et al. The Paris system in interstitial radiation therapy. Acta Radiol Oncol. 1978;17:33-48
5. van der Laarse R. The stepping source dosimetry system as an extension of the Paris system. In: (ed.) Mould RF, Battermann JJ, Martinez AA, Speiser BL. Brachytherapy from radium to optimization. Veenendaal, The Netherlands: Nucletron International. 1994:352-372
6. Kwan DK, Kagan AR, Olch AJ, Chan PYM. et al. Single - and double - plane iridium - 192 interstitial implants: Implantation guidelines and dosimetry. Med. Phys. 1983;10(4):456- 461
7. Zwicker RD, Schmidt R, Schiller B. Planning of Ir - 192 seed implants for boost irradiation to the breast. Int J Radtiat Oncol Biol Phys. 1985;11:2163- 2170
8. Nahum AE, Tait DM. Maximising control by customized dose prescription for pelvic tumours. In: (ed.) Advanced Radiation Therapy: Tumour Response Monitoring and Treatment Planning. Breit A (Heidelberg: Springer) 1992. 425-431
9. Visser AG, van den Aardweg GJMJ, Levendag PC. Pulse dose rate and fractionated high dose rate brachytherapy: Choice of brachytherapy schedules to replace low dose rate treatments. Int J Radtiat Oncol Biol Phys. 1996;34(2):497- 505
10. Kehwar TS. Analytical approach to estimate normal tissue complication probability using best fit of normal tissue tolerance doses into the NTCP equation of the linear quadratic model. J Cancer Res Ther. 2005;1(3):168-179
11. Meertens H, Borger J, Steggerda M, Blom A. Evaluation and optimization of interstitial brachytherapy dose distribution. In: (ed.) Mould RF, Battermann JJ, Martinez AA, Speiser BL. Brachytherapy from radium to optimization. Veenendaal, The Netherlands: Nucletron International. 1994:300-306
12. Saw CB, Suntharalingam N, Wu A. Concept of dose nonuniformity in interstitial brachytherapy. Int J Radiat Oncol Biol Phys. 1993;26(3):519- 27
13. Fowler JF. The linear-quadratic formula and progress in fractionated radiotherapy. Br J Radiol. 1989;62:679- 694
14. Kallman P, Agren A, Brahme A. Tumour and normal tissue responses to fractionated non-uniform dose delivery. Int J Radiat Biol. 1992;62:249- 62
15. Zaider M, Amols HI. Practical considerations in using calculated healthy - tissue complication probabilities for treatment - plan optimization. Int J Radiat Oncol Biol Phys. 1999;44:439- 47
16. Kehwar TS, Sharma SC. The best fit of the normal tissue tolerance data to the multiple component model. Polish J Med Phys Eng. 2003;9(4):239- 269
17. Emami B, Lyman J, Brown A. et al. Tolerance of normal tissue to therapeutic radiation. Int J Radiat Oncol Biol Phys. 1991;21:109- 122
18. Webb S, Nahum AE. A model for calculating tumour control probability in radiotherapy including the effects of inhomogeneous distributions of dose and clonogenic cell density. Phys Med Biol. 1993;38:653- 666
19. Overgaard M. The clinical implication of non-standard fractionation. Int J Radiat Oncol Biol Phys. 1985;11:1225-1226
20. Overgaard M. Spontaneous radiation-induced rib fractures in breast cancer patients treated with postmastectomy irradiation. Acta Oncologica. 1988;27:117-122
21. Saw CB, Suntharalingam N. Quantitative assessment of interstitial implants. Int J Radiat Oncol Biol Phys. 1990;20:135- 139
22. Saw CB, Suntharalingam N. Reference dose rates for single- plane and double-plane Iridium-192 implants. Med Phys. 1988;15:391- 396
23. Baltas D, Kolotas C, Geramani K. et al. A conformal index (COIN) to evaluate implant quality and dose specification in brachytherapy. Int J Radiat Oncol Biol Phys. 1998;40:515- 524
24. Anacak Y, Esassolak M, Aydin A. et al. Effect of geometric optimization on the treatment volumes and the dose homogeneity of biplane interstitial brachytherapy implants. Radoth Oncol. 1997;45:71- 76
25. Kolkman-Deurloo IKK, Visser AG, Niel CGJH. et al. Optimization of interstitial volume implants. Radioth Oncol. 1994;31:229- 239
26. Major T, Polgar C, Somogyi A. et al. Evaluation of the dose uniformity for double-plan high dose rate interstitial breast implants with the use of dose reference points and dose non-uniformity ratio. Radioth Oncol. 2000;54:213- 220
27. Stavreva NA, Stavrev PV, Round WH. Comments on the article “A model for calculating tumour control probability in radiotherapy including the effect of inhomogeneous distributions of dose and clonogenic cell density”. Phys Med Biol. 1995;40:1735-1738
28. Webb S, Evans PM, Swindell W, Deasy JO. A proof that uniform dose gives the greatest TCP for fixed integral dose in the planning target volume. Phys Med Biol. 1994;39:2091-2098
APPENDIX – A. Biologically Effective Equivalent Uniform Dose (BEEUD) for Tumors
The tumor control probability (TCP) for uniform dose distribution within the target (tumor) volume is given by equation (7) in the text. To get maximum tumor cell killing in a tumor with uniform clonogenic cell density and avoid necrosis of the normal tissue present within the target volume, the dose distribution within the target volume should be uniform [18, 27, 28]. However in HDR interstitial implants uniform dose distribution is rarely achieved. Hence the biologically effective dose (BED) or TCP calculated on the basis of the dose that corresponds to the isodose surface which encompasses the target volume or mean or median target dose would not be an appropriate representative to predict an accurate treatment outcome. Therefore, to account for non – uniform dose distribution, the target volume is divided into n number of sub-volumes (voxels). The number of sub-volumes depends on the volume of the target and user choice. The larger the number of the sub-volumes the more accurate the calculations. If the volume of each voxel is small enough, the dose distribution within the voxel may be considered uniform. Now the TCP is calculated voxel by voxel, and net TCP for entire target volume is given by product of all voxel based TCPs, which can be written as
TCP = Πi exp[ - ρ vi exp( - αBEDti)] (a)
Where BEDti is the BED of ith voxel of volume vi of the target. Here i = 1, 2, 3, ………n. Equation (a) may be written as
TCP = exp[ - ρ Σi vi exp( - αBEDti)] (b)
Let us assume that Biologically Effective Equivalent Uniform Dose (BEEUD) is the biological dose that produces equivalent biological effect to that of an absolutely uniform dose delivered to the entire target volume V. For such type of dose TCP is given by
TCP = exp[ - ρ V exp( - αBEEUDt)] (c)
By equating and rearranging the equations (b) and (c), we get an expression of BEEUD for tumor and may be written by
BEEUDt = (1/α) ln[(1/V)Σivi exp( - α BEDti)] (d)
Where i = 1, 2, 3, ………n. In the calculation of TCP, for non-uniform dose distribution within the tumor, the use of BEEUD is an appropriate term instead of BED.
APPENDIX – B. Biologically Effective Equivalent Uniform Dose (BEEUD) for Normal Tissues
The Biologically Effective Equivalent Uniform Dose (BEEUD) derived in Appendix – A can not be applied to predict NTCP because dose distribution in normal tissue / organ and the NTCP formulae are not similar to that of the tumor. The BEEUD for normal tissue / organ is derived using NTCP model, and is given in equation (11). The dose distribution within normal tissue / organ is highly heterogeneous. Hence to derive BEEUD for such a dose distribution, entire volume of the normal tissue / organ is divided into n number of sub-volumes (voxels), similar to that of target volume. Accuracy of the NTCP depends on the number of sub-volumes. If the volume of each voxel is small enough, the dose distribution within the voxel may be considered uniform. In reality, the dose gradient within adjacent normal tissues / organs to the target volume is too high, so it is not possible to have uniform dose distribution in any voxel. The NTCP equation for ith voxel is written as
NTCPi = exp[ - N0 (Vi/V0)-k exp( - α BEDni)] (e)
The NTCP is not an additive term of the volume, so the NTCPs of the voxels can not provide net NTCP of entire normal tissue / organ volume. For the purpose, equation (e) may be written in the additive form of the volume and new term is known as the NTCP factor (NTCPF). By taking logarithm of both sides of equation (e), we have
ln(NTCPi) = - N0 (Vi/V0)-k exp( - α BEDni)
or
[ - ln(NTCPi)] = N0 (Vi/V0)-k exp( - α BEDni)
or
[ - ln(NTCPi)] -1/k = (N0)-1/k (Vi/V0) exp[(α/k) BEDni
or
[(1/k) ln(NTCPi)] = (N0)-1/k (Vi/V0) exp[(α/k) BEDni
Taking exponential to both sides we may write
exp[(1/k) ln(NTCPi)] = exp[(N0)-1/k (Vi/V0) exp{(α/k) BEDni}]
Write out L.H.S equals to NTCPF and may be written as
NTCPFi = exp[(N0)-1/k (Vi/V0) exp{(α/k) BEDni}] (f)
Where V0 is the reference volume of the normal tissue / organ and Vi is the volume of ith voxel of the normal tissue /organ. It may be assume that NTCPF for each voxel is mutually exclusive, hence, the NTCPF for entire volume of the normal tissue / organ can be written as
NTCPF = exp[(N0)-1/k Σi{(Vi/V0) exp[(α/k) BEDni]}] (g)
Let us assume that Biologically Effective Equivalent Uniform Dose (BEEUD) is the biological dose delivered uniformly to the entire organ volume V0 that produces equivalent NTCPF to that of equation (g), which may be given by
NTCPF = exp[(N0)-1/k (V0/V0)exp{(α/k) BEEUDn}]
or
NTCPF = exp[(N0)-1/k exp{(α/k) BEEUDn}] (h)
By equating and rearranging equations (g) & (h) we have an expression of BEEUD for normal tissue / organ, which may be given by
BEEUDn = (k/α) ln[Σi{(Vi/V0) exp[(α/k) BEDi]}] (i)
In the calculation of NTCP, the use of BEEUD, for normal tissue / organ with highly non-uniform dose distribution, would provide better radiobiological in sites.
Author contact
![]() Correspondence to: T. S. Kehwar, D.Sc., DABR, Department of Radiation Oncology, University of Pittsburgh Cancer Institute, Robert E. Eberly Pavilion, UPMC Cancer Center, 51 Brewer Drive, Uniontown, PA 15401. Phone: (724) 437 2503; Fax: (724) 437 8846; Email: drkehwarcom
Correspondence to: T. S. Kehwar, D.Sc., DABR, Department of Radiation Oncology, University of Pittsburgh Cancer Institute, Robert E. Eberly Pavilion, UPMC Cancer Center, 51 Brewer Drive, Uniontown, PA 15401. Phone: (724) 437 2503; Fax: (724) 437 8846; Email: drkehwarcom