Impact Factor ISSN: 1449-1907

 Global reach, higher impact
Int J Med Sci 2007; 4(1):28-35. doi:10.7150/ijms.4.28 This issue Cite
Research Paper
Functional genomics analysis of low concentration of ethanol in human hepatocellular carcinoma (HepG2) cells. Role of genes involved in transcriptional and translational processes
Francisco Castaneda1, Sigrid Rosin-Steiner1, Klaus Jung2 3 ![]()
1. Laboratory for Molecular Pathobiochemistry and Clinical Research, Max Planck Institute of Molecular Physiology, Dortmund, Germany
2. Department of Statistics, University of Dortmund, D-44221 Dortmund, Germany
3. Medical Proteom-Center, Ruhr-University Bochum, D-44780 Bochum, Germany
Received 2006-11-26; Accepted 2006-12-15; Published 2006-12-21
Abstract
We previously found that ethanol at millimolar level (1 mM) activates the expression of transcription factors with subsequent regulation of apoptotic genes in human hepatocellular carcinoma (HCC) HepG2 cells. However, the role of ethanol on the expression of genes implicated in transcriptional and translational processes remains unknown. Therefore, the aim of this study was to characterize the effect of low concentration of ethanol on gene expression profiling in HepG2 cells using cDNA microarrays with especial interest in genes with transcriptional and translational function. The gene expression pattern observed in the ethanol-treated HepG2 cells revealed a relatively similar pattern to that found in the untreated control cells. The pairwise comparison analysis demonstrated four significantly up-regulated (COBRA1, ITGB4, STAU2, and HMGN3) genes and one down-regulated (ANK3) gene. All these genes exert their function on transcriptional and translational processes and until now none of these genes have been associated with ethanol. This functional genomic analysis demonstrates the reported interaction between ethanol and ethanol-regulated genes. Moreover, it confirms the relationship between ethanol-regulated genes and various signaling pathways associated with ethanol-induced apoptosis. The data presented in this study represents an important contribution toward the understanding of the molecular mechanisms of ethanol at low concentration in HepG2 cells, a HCC-derived cell line.
Keywords: human hepatocellular carcinoma cells, HepG2, ethanol, gene expression, transcriptional and translational processes
1. Introduction
Studies using the human hepatocellular carcinoma (HCC) cell line HepG2 have demonstrated a specific gene expression pattern induced by ethanol different from that observed in normal livers and in livers with alcoholic liver disease [1, 2]. In vivo studies using animal models, including rats [3], mice [4], and baboons [5] as well as human liver samples obtained from patients with advanced alcoholic liver disease [5], revealed changes in the expression of genes coding for transcription factors, signaling molecules, stress response and ethanol metabolism [1]. These studies, however, have been performed using high concentrations of ethanol.
Gene expression profiling using microarray technology allows the expression analysis of thousands of genes simultaneously [6-8]. This method is more informative than nonparallel studies on single genes [9, 10] providing information of networks of gene expression changes [11] [12]. The cDNA microarray technique has been used to evaluate the global gene expression in HCC as well as HCC-derived cell lines [13-16]. Moreover, HepG2 cells can be used to analyze the effect of ethanol on gene expression in HCC, based on the fact that HepG2 cells retain the genomic expression of HCC [15, 17, 18].
We previously reported the effect of ethanol at low concentration (namely 1 mM) on induction of different signaling pathways initiated through protein kinases phosphorylation with subsequent expression of transcription factors (AP1, Elk1, Stat1, SRF and NFκB) and expression of apoptotic genes (Fas receptor, Fas ligand, FADD and caspase 8) [19]. However, the effect of low concentration of ethanol on genes involved in transcriptional and translational processes remains to be characterized. Therefore, the aim of this study was to identify the effect of low concentration of ethanol (1 mM for 6 h) on gene expression, specifically from genes with transcriptional and translational function, in HepG2 cells compared to HepG2 cells not exposed to ethanol (control cells) using cDNA microarrays. We identified four significantly up-regulated (COBRA1, ITGB4, STAU2, and HMGN3) and one down-regulated (ANK3) gene. Notably, none of these genes have been previously associated with ethanol with the exception of ITGB4 that has been found up-regulated with high concentrations of ethanol.
This study represents an important advance in the characterization of the molecular mechanisms of low concentration of ethanol in HepG2 cells. Moreover, it constitutes a necessary step in the understanding of the molecular mechanisms involved in alcohol-induced effect in human hepatocellular carcinoma cells. In addition, this represents a novel approach for the identification of potential targets in the diagnosis and treatment of human hepatocellular carcinoma.
2. Materials and methods
Cell culture and reagents
Based on the reported alteration of gene expression of primary human hepatocytes in monolayer cultures [20] and the conserved gene expression profile in confluent HepG2 cells in vitro [21], the present study was performed only using HepG2 cells.
HepG2 cells were seeded in 250 ml tissue culture flasks (Falcon, Heidelberg, Germany) at 1x10⁵/ml concentration in 10 ml RPMI-1640 medium (Gibco, Eggersheim, Germany) supplemented with 10% fetal bovine serum (Boehringer Mannheim, Germany), 100 U/ml penicillin and 100 µg/ml streptomycin (ICN, Meckenheim, Germany) at 37°C in a humidified atmosphere of 7.5% CO2. The cells were grown to 80% confluence. After 2 days of cell culture, the cells were harvested with 0.05% trypsin / 0.02% EDTA (Gibco) and seeded in 6-well plates (Falcon) at concentrations of 1x10⁵/ml. Six sets of experiments were performed. Each set consist of two groups as follow: group 1, HepG2 treated cells with 1 mM ethanol for 6 h; and group 2, HepG2 cells without ethanol exposure used as a control. All chemicals were purchased from Sigma Aldrich (Seelze, Germany).
Both the ethanol concentration at millimolar level (1 mM) and the exposition time (6 hr) were chosen based on the data obtained from previous studies [22-24]. They demonstrated that ethanol at low concentrations selectively induces apoptosis in HepG2 cells without causing cell toxicity, which represents the hallmark of the ethanol effect when high concentrations are applied [25].
Total RNA extraction and microarray hybridization
Total RNA was extracted using RNase kit (Qiagen, Hilden, Germany) and its quality was confirmed by electropherograms using a 2100 BioAnalyzer (Agilent, Santa Clara, CA). Total RNA (5 µg) were used for preparing biotinylated cRNA using GeneChip IVT Labeling Kit (Affymetrix, Santa Clara, CA). After confirmation of the quality of labeled cRNA using the Affymetrix Test 3 Array, cRNA was converted to cDNA using GeneChip One-Cycle cDNA Synthesis Kit (Affymetrix). Fifteen micrograms of labeled and fragmented cRNA were subsequently hybridized to a Human Genome U133 plus 2.0 microarray (Affymetrix). After the hybridization, the DNA microarrays were washed and stained on a Fluidics Station (Affymetrix) according to manufacturer's instructions. Finally, the DNA microarrays were scanned with a GeneChip Scanner 3000 (Affymetrix).
DNA microarray analysis
Data analyses were performed using the GeneChip Expression Analysis Software (version 3.2, Affymetrix). First, single array analysis was performed [11] to calculate for each gene a signal, which represents a relative measure of the abundance of the transcript with a detection p-value. To evaluate the gene expression profile between group 1 (ethanol-treated) and group 2 (control) a hierarchical cluster analysis was performed [26-28].
For a quantitative estimation of the change in gene expression between both groups a pairwise comparison analysis was performed. For that purpose a signal log ratio (SLR; basis 2) using a one-step Tukey's biweight method was calculated [29] [30]. Genes with a SRL > 1 or <-1 in at least 3 experiments (50%) were selected for further analyses.
Quantitative real-time PCR Analysis
Quantitative real-time PCR was used to validate the effect of ethanol on gene expression. Total RNA was isolated from HepG2 cells using RNAsy kit (Qiagen) and RNA quality was evaluated using RNA 6000 Nano Chip Kit and Bioanalyzer 2100 (Agilent, Böbligen, Germany). Real-time PCR was performed using the QuantiTect SYBR green RT-PCR kit (Qiagen). Specific primers for each selected gene were used. A quantitative real-time PCR determination using the Optical System Software (iQ5 version 1.0) provided with the BioRad iQ5 cycler (BioRad, Munich, Germany) was performed. The following primers were used: ITGB4 forward, 5'-CCTGTACCCGTATTGCGACT-3'; ITGB4 reverse 5'-AGGCCATAGCAGACCTCGTA-3'; COBRA1 forward 5'-TGAAGGAGACCCTGACCAAC-3'; COBRA1 reverse 5'-ATCGAATACCGACTGGTGGA-3'; ANK3 forward 5'-GGAGCATCAGTTTGACAGCA-3'; ANK3 reverse 5'-TTCCACCTTCAGGACCAATC-3'; STAU2 forward 5'-CCGTGAGGGATACAGCAGTT-3'; STAU2 reverse 5'-GCCCATTCAGTTCCACAGTT-3'; HMGN3 forward 5'-TGCCAGATTGTCAGCGAAAC-3; HMGN3 reverse 5'-TGCTCCACCAAAACCTGAACCAAAC-3. All primers were synthesized by MWG Biotech AG (Ebersberg, Germany). Samples were prepared in triplicate and real time PCR measurement for each sample was done in duplicate. The expression level of each gene was normalized using the control group (group 2) and an induction ratio (treated/control) was obtained. The average of duplicate real time PCR measurements was used to calculate the mean induction ratio ± SD for each gene.
Statistical analysis
Data are expressed as mean values ± standard deviation (SD). Results from HepG2 cells treated with 1mM concentration of ethanol (group 1) were compared to non-treated HepG2 cells (control cells, group 2) using Student's t-test. Statistical significance was assumed at p level <0.05 level. SigmaPlot software version 8.02 (Systat Software, Erkrath, Germany) was used for statistical analysis.
Statistical analyses of microarray data were performed using a permutation procedure [31, 32] as well as a non-parametric method [33]. These two methods allowed us to analyze whether a gene had no expression change (null hypothesis) or whether it did (alternative hypothesis). Based on the expression measurements, a decision is made either for the null or the alternative hypothesis. In order to keep the number of false positive decisions small, the two testing procedures were set up to control for the family-wise error rate (FWER), which is the probability of having more than one false positive decision among all n tests. In particular, the testing procedures guaranteed an FWER ≤ 0.05 [34].
3. Results
Low concentration of ethanol selectively expresses genes involved in transcriptional and translational processes
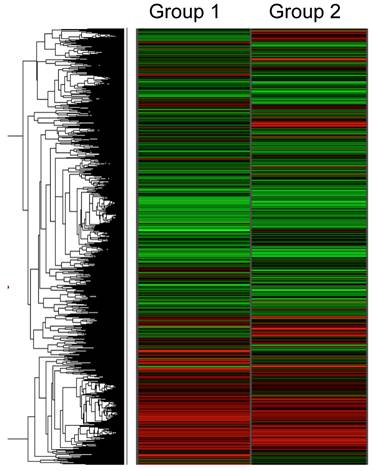
Figure 1 shows the hierarchical gene expression profile of 1 mM ethanol concentration treated HepG2 cells (group 1) and control cells (HepG2 cells without treatment; group 2) exposed for a 6 h period. Data are presented as a median of the signal obtained from the six different microarrays for each group (n=6). Each single array had good quality control and showed a normal distribution and linearity. The red zones indicate up-regulated gene expression and the green zones indicate down-regulated gene expression. The gene expression pattern between the two groups revealed a relatively similar pattern, suggesting that only few genes are changed with exposure of a low concentration of ethanol. The pairwise comparison analysis demonstrated the selective effect of ethanol on fives genes involved in transcriptional and translational processes. As shown in Table 1, the up-regulated genes were COBRA1, ITGB4, STAU2, and HMGN3 with a SLR of 3.30, 2.61, 1.68 and 1.52, respectively. ANK3 was the only significantly down-regulated gene with a SLR of -5.02.
Hierarchical clustering analysis of gene expression profile in ethanol-treated HepG2 cells (1 mM ethanol for 6 h, Group 1) compared to control HepG2 cells (Group 2). Each row represents the mean of signal log ratios (n=6 arrays each group) using a color-code scale. Red represents expression greater than reference, green is less than reference, and gray is missing or excluded data.
Ethanol-regulated genes obtained from the pairwise comparison analysis between ethanol-treated (1 mM for 6 h) and control HepG2 cells.
| Probeset | Gene symbol | Gene title | Signal Log Ratio | Function | Gene ID |
|---|---|---|---|---|---|
| 202757_at | COBRA1 | cofactor of BRCA1 | ▲ 3.30 | regulation of transcription | NM_015456 |
| 204990_s_at | ITGB4 | integrin, beta 4 | ▲ 2.61 | protein binding | NM_000213 |
| 204226_at | STAU2 | staufen, RNA binding protein, homolog 2 (Drosophila) | ▲ 1.68 | double-stranded RNA binding | NM_014393 |
| 209377_s_at | HMGN3 | high mobility group nucleosomal binding domain 3 | ▲ 1.52 | DNA binding | NM_004242 |
| 206385_s_at | ANK3 | ankyrin 3, node of Ranvier (ankyrin G) | ▼ 5.02 | protein binding | NM_001149 |
▲- increased
▼- decreased
Validation of microarray results by quantitative real time RT-PCR analyses
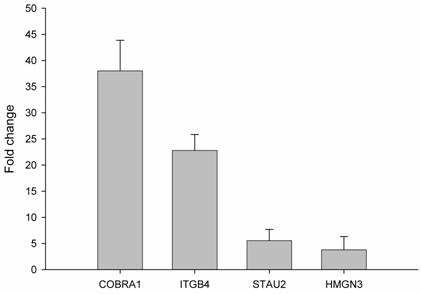
In order to validate the observed expression on the ethanol-regulated genes (COBRA1, ITGB4, STAU2, HMNG3, and ANK3), we performed quantitative real time RT-PCR in HepG2 cells treated with ethanol. The primers used showed a linear specificity. The results were normalized to control mRNA level (i.e. HepG2 cells without ethanol treatment). We did not use housekeeping genes, such as GADPH, actin or LDHA, because ethanol also alters the expression of these genes (data not shown). The relative mRNA level for each gene is shown in Figure 2. The obtained mRNA level for COBRA1, ITGB4, STAU2, and HMGN3 was 38.0, 22.7, 5.5, and 3.8, respectively. In the case of ANK3, the real time RT-PCR did not give any transcript with two different primers. This might be due to the strong down-regulation of ANK3 observed with ethanol treatment. The results from semi-quantitative RT-PCR quantified and confirmed the findings of the microarray analysis on gene expression in response to ethanol.
Validation of ethanol-regulated genes by real time RT-PCR. mRNA levels of ethanol-regulated genes determined by real time RT-PCR. Induction ratios of each gene (fold change) by ethanol were calculated using expression level, normalized to the level of the control group (HepG2 without ethanol treatment). Experiments were done in triplicate (n=3) and error bars indicate standard deviation among the triplicate samples.
Gene ontology analysis
Once the ethanol-regulated genes were validated, we analyzed further their implication in different biological processes. For this purpose, the ethanol-regulated genes were functionally clustered into specific biological processes from the classification systems of the gene ontology annotation [35]. The gene ontology analysis of the identified genes is shown in Table 2. The biological processes associated with the up-regulated genes in the ethanol-treated HepG2 cells were as follow: regulation of transcription for COBRA1; cell communication, cell adhesion, cell-matrix adhesion, integrin-mediated signaling, and development for ITGB4; transport for STAU2; and an unknown biological process for HMGN3. The biological processes in which ANK3, the down-regulated gene, was involved were protein targeting, cytoskeletal anchoring and signal transduction.
Gene ontology in terms of biological processes of the ethanol-regulated genes in HepG2 cells.
| Gene symbol | Gene ontology (GO) biological process | KEGG/ GenMAPP Pathway | ||
|---|---|---|---|---|
| COBRA1 | GO:0006350 | transcription | -- | |
| GO:0006355 | regulation of transcription, DNA-dependent | -- | ||
| ITGB4 | GO:0007154 | cell communication | hsa01430 | Cell Communication |
| GO:0007155 | cell adhesion | hsa04510 | Focal adhesion | |
| GO:0007160 | cell-matrix adhesion | hsa04512 | ECM-receptor interaction | |
| GO:0007229 | integrin-mediated signaling pathway | hsa04810 | Regulation of actin cytoskeleton | |
| GO:0007275 | development | -- | ||
| STAU2 | GO:0006810 | transport | -- | |
| HMGN3 | GO:0008150 | biological process unknown | -- | |
| ANK3 | GO:0006605 | protein targeting | -- | |
| GO:0007016 | cytoskeletal anchoring | |||
| GO:0007165 | signal transduction | |||
Additionally, we evaluated the functional pathways in which the ethanol-regulated genes were involved using KEGG (Kyoto Encyclopedia of Genes and Genomes) [36] and GenMAPP (Gene Microarray Pathway Profiler) [37] analysis. As shown in Table 2, only ITGB4 was found to be involved in intracellular pathways including cell communication, focal adhesion, extra cellular matrix-receptor interaction and regulation of cytoskeleton. These data suggest an important role of integrin in the molecular mechanisms of ethanol effects in HepG2 cells. The other ethanol-regulated genes were not found to be associated with any specific pathway.
Functional genomics analysis of ethanol-regulated genes
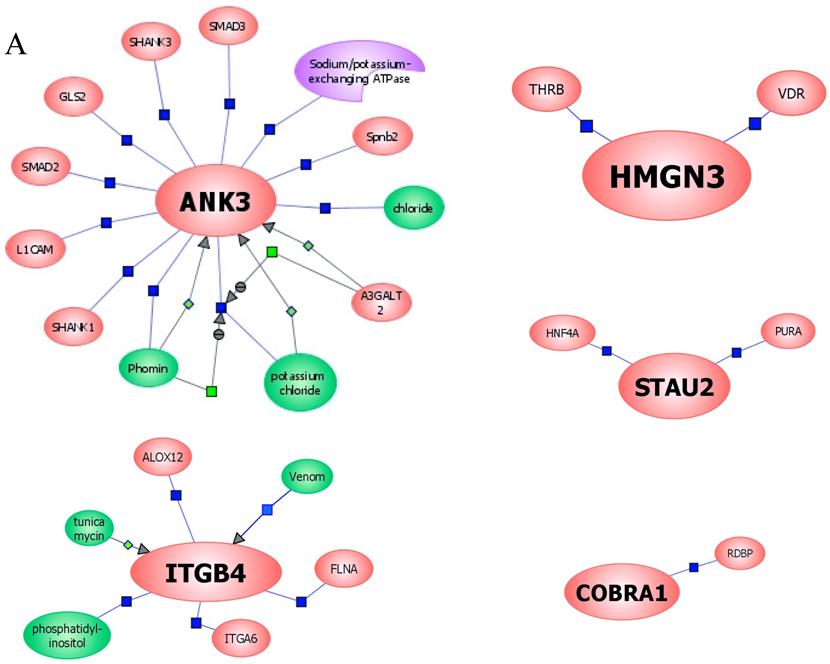
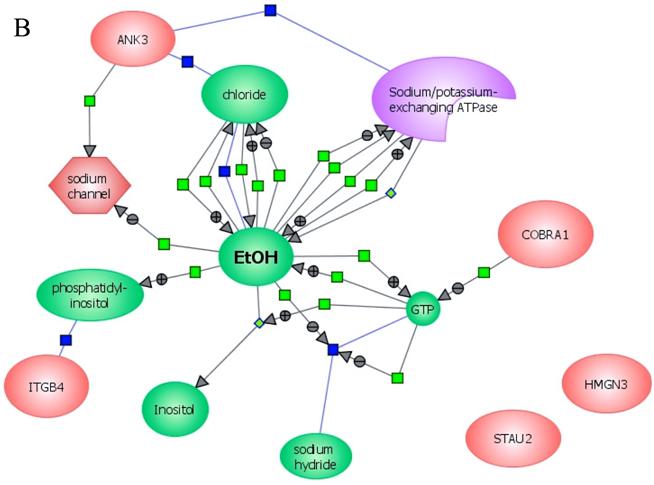
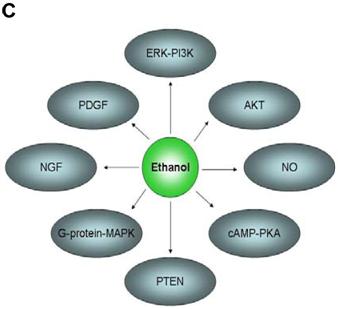
In an effort to find gene regulatory networks associated with low concentration of ethanol, we analyzed the interaction between the ethanol-regulated genes studied using Pathway Architect software (Stratagene). Figure 3A shows the reported interactions of each of these genes. ITGB4 and ANK3 are associated with different targets, including small molecules, genes and proteins. In contrast, COBRA1, STAU2 and HMGN3 are only associated with very few targets. Figure 3B shows the reported interaction network between ethanol and the five ethanol-regulated genes of interest. Of note, ITGB4, COBRA1 and ANK3 are indirectly associated with ethanol through phosphatidylinositol, GTP and chloride, respectively. There are until now no reported interactions observed for STAU2 and HMGN3. Figure 3C shows the interaction of ethanol with similar signaling pathways, in which ethanol-regulated genes are also involved. Such pathways include ERK-PI3K, AKT, NO, cAMP-PKA, PTEN, G-Protein-MAPK, NGF, and PDGF signaling. This finding corroborates the interaction observed between various intracellular signaling pathways and apoptosis induced by 1mM concentration of ethanol in HepG2 cells [19].
Functional genomics of low concentrations of ethanol in HepG2 cells. (A) Reported interactions of each ethanol-regulated gene studied. (B) Indirect interaction of ITGB4, COBRA1 and ANK3 with ethanol, as reported in the literature. (C) Interaction of ethanol with similar signaling pathways in which COBRA1, ITGB4, STAU2, HMGN3, and ANK3 are also involved.
4. Discussion
The gene expression profile of HepG2 cells exposed to a low concentration of ethanol (equivalent to 1mM) demonstrates a totally different pattern to that observed with exposure to ethanol at high concentrations. Ethanol at high concentration modulates multiple functional interactions explaining its toxic effect in the liver. In vitro studies using HepG2 cells over-expressing CYP2E1, an ethanol metabolizing enzyme, demonstrated that high concentrations of ethanol (100 mM) induced the expression of genes involved in the metabolism of ethanol [16]. In addition, the metabolism of ethanol results in an increased production of toxic metabolites such as free radicals. These metabolites have an effect on gene expression [30]. In contrast, our findings suggest that 1mM concentration of ethanol regulates genes that are not directly involved in ethanol metabolism. Specifically, the gene expression profile induced by this low concentration of ethanol suggests a balance between biological processes, as shown by the pattern of up- and down-regulated genes we observed. Among the ethanol-regulated genes we found, only ITGB4 has been reported in association with ethanol. Chronic ethanol consumption increases the expression of integrins but impairs hepatocyte attachment and spreading on various extracellular matrix substrates [38].
Importantly, low concentration of ethanol exerts its effect through induction of transcription factors (AP1, Elk1, Stat1, SRF and NFκB) and expression of apoptotic genes (Fas receptor, Fas ligand, FADD and caspase 8) [19]. In addition, as confirmed by the functional genomics analysis presented in this study, ethanol at low concentration (1 mM) also regulates the expression of genes involved in transcriptional and translational processes.
Integrins act as signal transducing molecules trough mitogen-activated protein (MAP) kinase like extracellular-regulated kinase 1 (ERK1) and ERK2 . Moreover, the role of MAP kinases on the modulation of gene expression depends on integrin engagement rather than simply on cell attachment . The increased expression of ITGB4 induced by 1 mM ethanol, we found, suggests a regulatory mechanism on the signal transduction pathways activated through ethanol.
The central role of ethanol on transcriptional regulation processes could be explained by the increased expression of COBRA1. The COBRA1 protein has been shown to be an integral subunit of the human negative transcription elongation factor . In addition, over-expression of COBRA1 represses the transcriptional activity of activating protein-1 (AP1) transcription factor [40]. Since ethanol-induced phosphorylation of protein kinases leads to an increased expression of transcription factors including AP1 [19], the effect of low concentration of ethanol on COBRA1 suggests a regulatory effect on transcription. Our data also demonstrated an increased expression of HMGN3. HMGN nuclear proteins bind specifically to nucleosomes, reduce the compactness of the chromatin fiber, and enhance transcription from chromatin templates . Interestingly, HMGN3 has been found to be associated with resistance against anticancer drugs including vinblastine, topotecan, paclitaxel and doxorubincin in human hepatocellular carcinoma derived cell lines . The resistance against anticancer drugs has been associated with the expression of transcription factors, such as NFκB and AP1 . These transcription factors are significantly over-expressed in ethanol-treated HepG2 cells, suggesting a role of ethanol-induced regulation on genes involved in transcriptional processes that could be applied to develop new strategies for the treatment of human hepatocellular carcinoma.
Our data also confirms the effect of low concentration of ethanol on genes involved in translational processes such as STAU2, a protein that facilitates the initiation of translation . Based on the increased expression of staufen proteins associated with Hepatitis C virus (HCV) infection , a leading cause of severe hepatitis that often develops into liver cirrhosis and hepatocellular carcinoma, the selective regulation of ethanol on STAU2 may represent an important target for future studies addressing the molecular mechanisms of ethanol on human hepatocellular carcinoma and requires further investigation.
Notably, the down-regulatory effect of 1mM ethanol concentration on ANK3 we observed, provides a potential therapeutic approach when considering the reported high expression of the ankyrin-repeat oncoprotein (gankyrin) in human hepatocellular carcinoma . Gankyrin binds to the cell-cycle regulator CDK4 and the S6b ATPase subunit of the regulatory component of the proteasome.
Based on the conserved gene expression profile in confluent HepG2 cells in vitro [21], the regulation of genes involved in transcriptional and translational processes we found suggests a potential therapeutic effect of ethanol at low concentration for the treatment of human hepatocellular carcinoma. However, it should be only considered for direct application into the tumor, known as percutaneous ethanol injection. The systemic application or the ingestion of ethanol induces a completely different pattern due to the reported ethanol-induced expression and activation of cytokines and chemokines in monocytes and macrophages (including Kupffer cells) [41, 42], and ethanol-induced mucosal injury in the upper gastrointestinal tract leading to increase in the permeability of the gut mucosa to endotoxins [43, 44]. These factors are involved in ethanol-induced liver damage. Thus, the direct injection of low concentration of ethanol for the treatment of hepatocellular carcinoma represents a promising alternative to improve the limitation of percutaneous ethanol injection, which is only indicated for small and single tumors [45, 46].
In conclusion, the functional genomics analysis presented in this investigation confirms the effect of ethanol at low concentration (1 mM) on the expression of genes involved in transcriptional and translational processes that are also associated with human hepatocellular carcinoma. These findings represent an important contribution toward the understanding of the molecular mechanisms of ethanol at low concentration in HepG2 cells, and a novel approach for the identification of potential targets in the diagnosis and treatment of human hepatocellular carcinoma.
Acknowledgements
We are grateful to Dr. Rolf K-H Kinne and Dr. Wolfgang Urfer for their valuable support.
Conflict of Interests
The authors declare no conflict of interests.
References
1. Harries HM, Fletcher ST, Duggan CM. et al. The use of genomics technology to investigate gene expression changes in cultured human liver cells. Toxicol In Vitro. 2001 ;15:399-405
2. Hong Y, Muller UR, Lai F. Discriminating two classes of toxicants through expression analysis of HepG2 cells with DNA arrays. Toxicol In Vitro. 2003 ;17:85-92
3. Deaciuc IV, Arteel GE, Peng X. et al. Gene expression in the liver of rats fed alcohol by means of intragastric infusion. Alcohol. 2004 ;33:17-30
4. Deaciuc IV, Doherty DE, Burikhanov R. et al. Large-scale gene profiling of the liver in a mouse model of chronic, intragastric ethanol infusion. J Hepatol. 2004 ;40:219-27
5. Seth D, Leo MA, McGuinness PH. et al. Gene expression profiling of alcoholic liver disease in the baboon (Papio hamadryas) and human liver. Am J Pathol. 2003 ;163:2303-17
6. Brown PO, Botstein D. Exploring the new world of the genome with DNA microarrays. Nat Genet. 1999 ;21:33-7
7. Khan J, Saal LH, Bittner ML. et al. Expression profiling in cancer using cDNA microarrays. Electrophoresis. 1999 ;20:223-9
8. Lockhart DJ, Winzeler EA. Genomics, gene expression and DNA arrays. Nature. 2000 ;405:827-36
9. Gray NS, Wodicka L, Thunnissen AM. et al. Exploiting chemical libraries, structure, and genomics in the search for kinase inhibitors. Science. 1998 ;281:533-8
10. Fambrough D, McClure K, Kazlauskas A. et al. Diverse signaling pathways activated by growth factor receptors induce broadly overlapping, rather than independent, sets of genes. Cell. 1999 ;97:727-41
11. Tackels-Horne D, Goodman MD, Williams AJ. et al. Identification of differentially expressed genes in hepatocellular carcinoma and metastatic liver tumors by oligonucleotide expression profiling. Cancer. 2001 ;92:395-405
12. Zhang W, Morris QD, Chang R. et al. The functional landscape of mouse gene expression. J Biol. 2004 ;3:21
13. Kawai HF, Kaneko S, Honda M. et al. alpha-fetoprotein-producing hepatoma cell lines share common expression profiles of genes in various categories demonstrated by cDNA microarray analysis. Hepatology. 2001 ;33:676-91
14. Okabe H, Satoh S, Kato T. et al. Genome-wide analysis of gene expression in human hepatocellular carcinomas using cDNA microarray: identification of genes involved in viral carcinogenesis and tumor progression. Cancer Res. 2001 ;61:2129-37
15. Shirota Y, Kaneko S, Honda M. et al. Identification of differentially expressed genes in hepatocellular carcinoma with cDNA microarrays. Hepatology. 2001 ;33:832-40
16. Lee JS, Thorgeirsson SS. Functional and genomic implications of global gene expression profiles in cell lines from human hepatocellular cancer. Hepatology. 2002 ;35:1134-43
17. Lowichik A, Schneider NR, Tonk V. et al. Report of a complex karyotype in recurrent metastatic fibrolamellar hepatocellular carcinoma and a review of hepatocellular carcinoma cytogenetics. Cancer Genet Cytogenet. 1996 ;88:170-4
18. Zimonjic DB, Keck CL, Thorgeirsson SS. et al. Novel recurrent genetic imbalances in human hepatocellular carcinoma cell lines identified by comparative genomic hybridization. Hepatology. 1999 ;29:1208-14
19. Castaneda F, Rosin-Steiner S. Low concentration of ethanol induce apoptosis in HepG2 cells: role of various signal transduction pathways. Int J Med Sci. 2006 ;3:160-67
20. Richert L, Liguori MJ, Abadie C. et al. Gene expression in human hepatocytes in suspension after isolation is similar to the liver of origin, is not affected by hepatocyte cold storage and cryopreservation, but is strongly changed after hepatocyte plating. Drug Metab Dispos. 2006 ;34:870-9
21. Butura A, Johansson I, Nilsson K. et al. Differentiation of human hepatoma cells during confluence as revealed by gene expression profiling. Biochem Pharmacol. 2004 ;67:1249-58
22. Castaneda F, Kinne RKH. Effects of doxorubicin, mitomycin C, and ethanol on Hep-G2 cells in vitro. J Cancer Res Clin Oncol. 1999 ;125:1-8
23. Castaneda F, Kinne RKH. Short exposure to millimolar concentrations of ethanol induces apoptotic cell death in multicellular HepG2 spheroids. J Cancer Res Clin Oncol. 2000 ;126:305-10
24. Castaneda F, Kinne RK. Cytotoxicity of millimolar concentrations of ethanol on HepG2 human tumor cell line compared to normal rat hepatocytes in vitro. J Cancer Res Clin Oncol. 2000 ;126:503-10
25. Castaneda F, Kinne RKH. Ethanol treatment of hepatocellular carcinoma: high potentials of low concentrations. Cancer Biol Ther. 2004 ;3:430-33
26. Eisen MB, Spellman PT, Brown PO. et al. Cluster analysis and display of genome-wide expression patterns. Proc Natl Acad Sci. 1998 ;95:14863-8
27. Alizadeh AA, Eisen MB, Davis RE. et al. Distinct types of diffuse large B-cell lymphoma identified by gene expression profiling. Nature. 2000 ;403:503-11
28. Bittner M, Meltzer P, Chen Y. et al. Molecular classification of cutaneous malignant melanoma by gene expression profiling. Nature. 2000 ;406:536-40
29. Lockhart DJ, Dong H, Byrne MC. et al. Expression monitoring by hybridization to high-density oligonucleotide arrays. Nature Biotechnology. 1996 ;14:1675-80
30. Bardag-Gorce F, French BA, Dedes J. et al. Gene expression patterns of the liver in response to alcohol: in vivo and in vitro models compared. Exp Mol Pathol. 2006 ;80:241-51
31. Dudoit S, Fridlyand J. A prediction-based resampling method for estimating the number of clusters in a dataset. Genome Biol. 2002 ;3:research0036
32. Dudoit S, Shaffer JP, Boldrick JC. Multiple Hypothesis Testing in Microarray Experiments. Statistical Science. 2003 ;18:71-103
33. Jung K, Quast K, Gannoun A. et al. A renewed approach to the nonparametric analysis of replicated microarray experiments. Biom J. 2006 ;48:245-54
34. Reiner A, Yekutieli D, Benjamini Y. Identifying differentially expressed genes using false discovery rate controlling procedures. Bioinformatics. 2003 ;19:368-75
35. Ashburner M, Ball CA, Blake JA. et al. Gene ontology: tool for the unification of biology. The Gene Ontology Consortium. Nat Genet. 2000 ;25:25-9
36. Kanehisa M, Goto S, Kawashima S. et al. The KEGG databases at GenomeNet. Nucleic Acids Res. 2002 ;30:42-6
37. Dahlquist KD, Salomonis N, Vranizan K. et al. GenMAPP, a new tool for viewing and analyzing microarray data on biological pathways. Nat Genet. 2002 ;31:19-20
38. Schaffert CS, Sorrell MF, Tuma DJ. Expression and cytoskeletal association of integrin subunits is selectively increased in rat perivenous hepatocytes after chronic ethanol administration. Alcohol Clin Exp Res. 2001 ;25:1749-57
39. Carloni V, Mazzocca A, Pantaleo P. et al. The integrin, alpha6beta1, is necessary for the matrix-dependent activation of FAK and MAP kinase and the migration of human hepatocarcinoma cells. Hepatology. 2001 ;34:42-9
40. Zhong H, Zhu J, Zhang H. et al. COBRA1 inhibits AP-1 transcriptional activity in transfected cells. Biochem Biophys Res Commun. 2004 ;325:568-73
41. McClain CJ, Barve S, Deaciuc I. et al. Cytokines in alcoholic liver disease. Seminars in Liver Disease. 1999 ;19:205-19
42. Jaeschke H, Gores GJ, Cederbaum AI. et al. Mechanisms of hepatotoxicity. Toxicological Sciences. 2002 ;65:166-76
43. Bode C, Bode JC. Activation of the innate immune system and alcoholic liver disease: effects of ethanol per se or enhanced intestinal translocation of bacterial toxins induced by ethanol? Alcohol Clin Exp Res. 2005 ;29:166S-71S
44. Fukui H. Relation of endotoxin, endotoxin binding proteins and macrophages to severe alcoholic liver injury and multiple organ failure. Alcohol Clin Exp Res. 2005 ;29:172S-79S
45. Hsu C, Cheng JC, Cheng AL. Recent advances in non-surgical treatment for advanced hepatocellular carcinoma. J Formos Med Assoc. 2004 ;103:483-95
46. Lin XD, Lin LW. Local injection therapy for hepatocellular carcinoma. Hepatobiliary Pancreat Dis Int. 2006 ;5:16-21
Author contact
![]() Correspondence to: Francisco Castaneda, MD, Laboratory for Molecular Pathobiochemistry and Clinical Research, Max Planck Institute for Molecular Physiology, Otto-Hahn-Str. 11, 44227 Dortmund, Germany; Tel. 49-231-9742-6490, Fax. 49-231-133-2699, E-mail: francisco.castanedampg.de
Correspondence to: Francisco Castaneda, MD, Laboratory for Molecular Pathobiochemistry and Clinical Research, Max Planck Institute for Molecular Physiology, Otto-Hahn-Str. 11, 44227 Dortmund, Germany; Tel. 49-231-9742-6490, Fax. 49-231-133-2699, E-mail: francisco.castanedampg.de