Impact Factor ISSN: 1449-1907

 Global reach, higher impact
Int J Med Sci 2007; 4(1):19-27. doi:10.7150/ijms.4.19 This issue Cite
Research Paper
Strength training improves muscle quality and insulin sensitivity in Hispanic older adults with type 2 diabetes
Naomi Brooks1, Jennifer E. Layne1, Patricia L. Gordon1 3, Ronenn Roubenoff1 2, Miriam E. Nelson1 2 4, Carmen Castaneda-Sceppa1 2 ![]()
1. Jean Mayer USDA Human Nutrition Research Center on Aging, Tufts University, Boston MA, USA.
2. The Friedman School of Nutrition Science and Policy, Tufts University, Boston MA, USA.
3. Department of Physiological Nursing, University of California, San Francisco, CA, USA.
4. John Hancock Center for Physical Activity and Nutrition, Tufts University, Boston, MA, USA
Received 2006-11-8; Accepted 2006-12-16; Published 2006-12-18
Abstract
Hispanics are at increased risk of morbidity and mortality due to their high prevalence of diabetes and poor glycemic control. Strength training is the most effective lifestyle intervention to increase muscle mass but limited data is available in older adults with diabetes. We determined the influence of strength training on muscle quality (strength per unit of muscle mass), skeletal muscle fiber hypertrophy, and metabolic control including insulin resistance (Homeostasis Model Assessment –HOMA-IR), C-Reactive Protein (CRP), adiponectin and Free Fatty Acid (FFA) levels in Hispanic older adults. Sixty-two community-dwelling Hispanics (>55 y) with type 2 diabetes were randomized to 16 weeks of strength training plus standard care (ST group) or standard care alone (CON group). Skeletal muscle biopsies and biochemical measures were taken at baseline and 16 weeks. The ST group show improved muscle quality (mean±SE: 28±3) vs CON (-4±2, p<0.001) and increased type I (860±252µm2) and type II fiber cross-sectional area (720±285µm2) compared to CON (type I: -164±290µm2, p=0.04; and type II: -130±336µm2, p=0.04). This was accompanied by reduced insulin resistance [ST: median (interquartile range) -0.7(3.6) vs CON: 0.8(3.8), p=0.05]; FFA (ST: -84±30µmol/L vs CON: 149±48µmol/L, p=0.02); and CRP [ST: -1.3(2.9)mg/L vs CON: 0.4(2.3)mg/L, p=0.05]. Serum adiponectin increased with ST [1.0(1.8)µg/mL] compared to CON [-1.2(2.2)µg/mL, p<0.001]. Strength training improved muscle quality and whole-body insulin sensitivity. Decreased inflammation and increased adiponectin levels were related with improved metabolic control. Further studies are needed to understand the mechanisms associated with these findings. However, these data show that strength training is an exercise modality to consider as an adjunct of standard of care in high risk populations with type 2 diabetes.
Keywords: diabetes, strength training, Hispanic, skeletal muscle, insulin sensitivity
1. Introduction
Type 2 diabetes is a chronic disease characterized by hyperglycemia and disturbances of carbohydrate, fat and protein metabolism [1]. Diet, exercise and weight loss are cornerstones of diabetes management to improve glycemic control, reduce muscle wasting and mortality [2]. Targeted interventions are needed to improve long-term diabetes control in high risk groups, like Hispanic older adults for whom diabetes and poor glycemic control are prevalent [3].
Endurance training has traditionally been advocated for people with diabetes [4]. More recently, strength training has been tested as a means to build muscle mass, strength and quality in healthy individuals and those suffering from chronic conditions like diabetes. Muscle quality, defined as maximal force production per unit of muscle mass, may be a better indicator of muscle function than strength alone [5]. There are many properties of skeletal muscle which contribute to muscle quality including fiber type, composition and size; contractile properties; innervation; capillarity and metabolic capacity [6]. Muscle quality has been shown to be lower in older than younger individuals [7] and recently, it has been noted that people with diabetes have significantly lower muscle quality than those without the disease [8].
Adipokines are soluble proteins released from adipocytes in response to metabolic signals and are involved in insulin resistance and inflammation [9]. In contrast to other adipokines, adiponectin levels decrease with increasing fat mass and higher levels of plasma adiponectin are independently associated with reduced risk of type 2 diabetes in healthy individuals [10]. Adiponectin also has an anti-inflammatory action [11]. Since diabetes and obesity are considered chronic inflammatory states, we chose to measure a prominent systemic marker of low-grade tissue inflammation, C-reactive Protein (CRP) [12]. Circulating levels of CRP are associated with adiponectin [12] and individuals with the metabolic syndrome have higher levels of CRP [13].
There is relatively sparse amount of literature on high-intensity strength training and diabetes in high risk populations. Maiorana et al. [14] circuit training intervention found increase in muscle mass and strength, and cardiovascular fitness. Similalry, Cauza et al. [15] , Tokmakidis et al. [16], and Eriksson et al [17] showed that moderate-intensity strength training is an effective exercise modality to achieve glycemic control and improve insulin sensitivity in subjects with type 2 diabetes. More recently, two randomized control trials of high-intensity strength training by Dunstan et al. [18] and Castaneda et al. [19], with the latter representing the parent study from which the present investigation has been derived; have shown that long-term strength significantly improves glycemic control and increases skeletal muscle mass. In addition, strength training has also been shown to influence a number of factors associated with whole-body insulin sensitivity such as CRP and pro-inflammatory cytokines [20]. A few recent studies have investigated exercise training on circulating adiponectin levels. These studies have shown that greater increases in adiponectin levels are associated with higher intensities of endurance exercise training [21, 22] and strength training [23].
To our knowledge no previous studies have investigated the effects of high-intensity strength training on muscle quality and whole-body insulin sensitivity in a high risk population of older adults with diabetes. This is why we chose to conduct this investigation in Hispanic older adults with type 2 diabetes. We hypothesized that 16 weeks of high-intensity strength training would result in improved muscle quality, skeletal muscle fiber hypertrophy as well as improved metabolic control (as measured by reduced insulin resistance and inflammation) in these study subjects.
2. Research Design and Methods
Subject characteristics
Sixty-two Hispanic individuals, 55 years and older with type 2 diabetes were randomized to 16 weeks of strength training plus standard care (ST group, n=31) or standard care alone (CON group, n=31). General methodology has been previously reported [19]. Briefly, diabetes was confirmed by a fasting plasma glucose ≥ 7.0 mmol/L or use of diabetic medications. Exclusion criteria included the following: myocardial infarction (within past 6 months), any unstable chronic condition including dementia, alcoholism, dialysis, retinal hemorrhage or detachment, or current participation in resistance training. Written informed consent was given in Spanish, as approved by the Institutional Review Board at Tufts University-New England Medical Center.
Intervention
Strength training (ST) group
Subjects reported to the Jean Mayer USDA Human Nutrition Research Center on Aging (HNRCA) 3x/week for 16 weeks for exercise training. Exercise sessions included 35-min strength training using five pneumatic machines: upper back, chest press, leg press, knee extension and flexion (Keiser Sports Health Equipment Inc., Fresno, CA) with 3 sets of 8 repetitions on each machine preceded by 5-min warm-up and ended with 5-min cool-down. Training intensity during wks 1-8 were 60-80% of baseline 1-repetition maximum (1RM), and during wks 10-14 were 70-80% of mid-study 1RM. Postprandial blood glucose was monitored before and after exercise using a One Touch Glucometer (Lifescan Inc., Johnson & Johnson Co., Milpitas, CA).
Control (CON) group
Subjects randomized to this group were asked to continue their usual standard of care. This included actions known to favorably affect health outcomes such as: glycemic control, blood glucose self-monitoring, engaging in healthy food choices and physical activity, and compliance with medications and doctor's visits [24]. Subjects in this group received phone calls every other week and came to the HNRCA for testing at baseline and 16 weeks. We chose this approach rather than an attention-control to test the effect of standard of care alone.
Outcome measures
Baseline measures were taken prior to randomization. Post-intervention measures were performed in a blinded manner except for muscle strength.
Body composition
Body mass index (BMI) was calculated from body weight and height as kg/m2. Whole-body and regional lean and fat mass were determined by Dual-X ray absorptiometry (DXA) using an Hologic QDR2000 (Waltham, MA) scanner operating in array mode with software 5.64A, with a coefficient of variation of 1.4% and 1.8% for lean and fat mass, respectively [25]. DXA has been validated against multicompartment methods and in-vivo neutron inelastic scattering [25]. Waist circumference was determined by standard technique.
Muscle strength
Muscle strength 1RM was assessed twice at baseline and once during week 16 on each training machine. Initial training loads and analyses used the highest of the two 1RM values assessed at baseline. The coefficient of variation for repeated measures at baseline was less than 10%. Upper and lower body strength at baseline and 16 weeks was calculated as the sum of 1RM measures for each upper and lower body exercise performed.
Muscle quality
Skeletal muscle quality as defined by the ratio of strength per unit of muscle mass [7]. There are a number of ways to express muscle quality. We chose to calculate muscle quality from leg 1RM strength (leg press, knee extension and knee flexion) in kg divided by leg lean body mass in kg, without bone mineral content, as measured by DXA. The appendicular fat-free mass derived from leg measurement of DXA is assumed to be a valid estimation of skeletal muscle [26].
Skeletal muscle histology: Fiber type and cross-sectional area (CSA)
Skeletal muscle samples were obtained from a sub-set of individuals who agreed to have the procedure (n = 24 ST, n = 18 CON). Percutaneous needle biopsies were taken from the non-dominant vastus lateralis using a 5 mm Bergstrom needle [27] at baseline and 72 h after final 1RM strength testing (wk 16). Muscle samples were oriented longitudinally, mounted in embedding medium (Tissue-Tek OCT, Miles Laboratories, Elkhart, IN), and frozen in isopentane cooled in liquid nitrogen. Transverse sections (10µm) were cut using a Leica CM1850-Cryostat (Leica Microsystem, Nussloch, Germany). Staining for myofibrillar adenosine triphosphatase (mATPase) was done at pH 4.3 [28]. Type I and II muscle fiber cross-sectional areas were determined in 75-250 fibers for each subject at each time point. Samples were analyzed under light microscopy and areas determined using an Image Software version 1.39 (Dr. W. Rasband, National Institute of Aging, Bethesda, MD), modified for our laboratory by Chun-ShanYam Ph.D. (SyLoc Consulting LLP, Lexington, MA) with CV of 3% [28].
Biochemical measures
Fasting blood measures were taken at baseline and 72 h after final 1RM strength testing (wk 16). Fasting plasma glucose was determined by the hexokinase enzymatic method (Sigma Diagnostics, St. Louis, MO) and insulin levels by radioimmunoassay (ICN Biomedical Inc., Costa Mesa, CA) with CV of 5%. Free fatty acids (FFA) were determined by in vitro enzymatic colorimetric endpoint method for quantification of non-esterified FFA in serum (Walo Chemicals USA, Inc., Richmond, VA) with CV of 6%. Serum C-Reactive Protein (CRP) levels were measured by an immunoturbidimetric commercially available kit in a Cobas Fara II automated centrifugal analyzer (CRP SPQ Test System, DiaSorin Inc., Stillwater, MN) with CV of 5%. Serum adiponectin was determined in duplicate using a highly sensitive, quantitative sandwich enzyme immunoassay technique (Human Adiponectin/Acrp30 Quantikine Immunoassay, R&D Systems, Minneapolis, MN) with CV of 3%.
HOMA-IR
Whole-body insulin resistance was estimated using the homeostasis model assessment of insulin resistance (HOMA-IR) which correlates well with the euglycemic hyperinsulinemic clamp in people with diabetes [29]. The following formula was used: HOMA-IR = [fasting Glucose (mmol/L)*fasting Insulin (uU/ml)]/22.5.
Subject Monitoring
Subjects continued their usual medical care and received Spanish translated recommendations for diabetes self-management [24]. They were not given dietary counseling other than to follow standard recommendations given by their health care providers. Both groups were administered a weekly symptom checklist to document blood glucose self-monitoring, diabetes control, medical visits, medication changes, acute illness, and hospitalizations. Past seven-day, self-reported leisure and household physical activity was monitored using the Physical Activity Scale for the Elderly [30]. Dietary intake was assessed using a food frequency questionnaire adapted for the Hispanic population [31].
Statistical Analysis
Statistical analysis was based on intention-to-treat analysis using SPSS 12.0 for Windows (SPSS, Inc., Evanston, IL). Results were considered statistically significant with a two-tailed p-value < 0.05. Data are shown as mean and standard error (SE), except for non-normally distributed variables (insulin, HOMA-IR, CRP, adiponectin) for which group median and interquartile ranges are shown. The non-normally distributed variables were log-transformed, checked for normality after log transformation, and used as continuous log-transformed variables for analyses. Baseline comparisons were assessed by independent sample t-test or Chi-square as appropriate. Repeated measures analysis of covariance (ANCOVA) was used to assess differences in outcome measures (muscle quality, muscle fiber size and metabolic parameters) between the two groups across time, as well as time-by-group interactions adjusting for insulin therapy as this was the only variable different between groups at baseline (Table 1), and for the observed changes in leisure time physical activity and diabetes medications observed after the intervention. Secondary model-building stepwise regression analyses of the change (weeks 16-0) in type I muscle fiber CSA (as the dependent variable) were carried out by group in order to determine the associations of selected factors on the change in type I CSA. Independent variables included in the models were the changes in HOMA-IR, CRP, adiponectin, and FFA.
Baseline Subject Characteristics
| ST Group N=31 | CON Group N=31 | P valuea | |
|---|---|---|---|
| Age (years) | 66 ± 2 | 66 ± 1 | 0.76 |
| Sex (male/female) | 21/10 | 19/12 | 0.59 |
| BMI (kg/m2) | 30.9 ± 1.1 | 31.2 ± 1.0 | 0.81 |
| Whole-Body Fat Mass (kg) | 35.0 ± 2.2 | 33.7 ± 2.4 | 0.70 |
| Waist Circumference (cm) | 99.7 ± 2.3 | 100.1 ± 2.6 | 0.63 |
| Fasting Glucose (mmol/L) | 8.79 ± 0.48 | 9.85 ± 0.69 | 0.21 |
| Fasting Insulin (pmol/L) | 116 (124) | 115 (131) | 0.58 |
| HOMA-IR | 7.1 (5.7) | 6.7 (9.0) | 0.96 |
| Glycosylated Hb A1C (%) | 8.7 ± 0.3 | 8.4 ± 0.3 | 0.58 |
| Diabetes Duration (y) | 8 ± 1 | 11 ± 1 | 0.22 |
| Insulin Therapy (n) | 15 | 5 | 0.02 |
Data are mean ± SE except for not normally distributed variables (insulin and HOMA-IR) which show median (interquartile range).
a Baseline comparisons between groups were assessed by independent sample t-test comparisons for continuous and log transformed variables or Chi-square for categorical variables.
3. Results
Baseline characteristics and study monitoring
The subject characteristics at baseline are shown in Table 1. The ST and CON groups did not differ by age, sex, body composition or metabolic characteristics, except that a higher proportion of prescribed insulin therapy was found in participants randomized to the ST group. As previously described [19], diabetic medication regimens were reduced in 22 out of the 31 (72 %) subjects in the ST group with 13 subjects having a reduction in sulfonylureas, 7 in biguanides, and 2 in insulin therapy. In contrast, CON subjects showed the opposite pattern. Thirteen out of 31 (42 %) subjects experienced an increase in their diabetes medication dosages, with 4 subjects having an increase in sulfonylureas, 6 in biguanides, and 3 in insulin therapy. The changes in medications, as prescribed by subjects' primary care physicians, were different between groups (p= 0.03). Another change resulting from the intervention was a significant increase in leisure time physical activity in the ST group, outside of training regimen, as compared to CON subjects (ST: 187 ± 27 kcal/wk vs CON: -50 ± 19 kcal/week; p<0.001). Finally, there was no change in dietary intake as a result of this intervention (data not shown).
Muscle quality and muscle fiber size
Compliance to strength training was 90 ± 10 %. Muscle strength, lean tissue mass, muscle quality, and vastus lateralis muscle fiber cross-sectional area are shown in Table 2. Mean upper and lower body muscle strength was significantly improved in with ST compared to CON subjects. This is not surprising given that the mean training intensity achieved by the ST group was 70.2 ± 1.3 % of 1RM (range: 66 to 75 %). Whole-body lean body mass also increased in the ST group, while leg lean tissue mass did not change between the groups. Muscle quality, a functional measurement of strength per unit volume of muscle (calculated from lower body muscle strength values in kg and leg lean tissue mass in kg), was significantly improved in the ST group vs CON group. Finally, we observed hypertrophy of type I and type II muscle fiber CSA in the ST group compared to CON subjects.
Muscle Quality and Muscle Fiber Size
| ST Group | CON Group | P valuea | |||
|---|---|---|---|---|---|
| N=31 | Change | N=31 | Change | ||
| Upper Body Muscle Strength (kg) | |||||
| Baseline | 66 ± 4 | 62 ± 4 | |||
| Final | 90 ± 6 | 24 ± 2 | 58 ± 4 | - 4 ± 2 | <0.001 |
| Lower Body Muscle Strength (kg) | |||||
| Baseline | 338 ± 27 | 300 ± 28 | |||
| Final | 568 ± 34 | 173 ± 19 | 285 ± 27 | - 19 ± 7 | <0.001 |
| Whole-Body Lean Tissue Mass (kg) | |||||
| Baseline | 44.3 ± 1.7 | 44.9 ± 1.9 | |||
| Final | 45.5 ± 1.9 | 1.1 ± 0.3 | 44.8 ± 1.7 | 0.4 ± 0.2 | 0.04 |
| Leg Lean Tissue Mass (kg) | |||||
| Baseline | 12.9 ± 0.6 | 12.7 ± 0.6 | |||
| Final | 13.1 ± 0.6 | 0.2 ± 0.1 | 12.8 ± 0.5 | 0.1 ± 0.2 | 0.28 |
| Muscle Quality | |||||
| Baseline | 61 ± 5 | 51 ± 4 | |||
| Final | 100 ± 6 | 28 ± 3 | 48 ± 4 | - 4 ± 2 | <0.001 |
| Type I muscle fiber area (µm2) | |||||
| Baseline | 4068 ± 256 | 4546 ± 270 | |||
| Final | 4928 ± 372 | 860 ± 252 | 4381 ± 304 | - 164 ± 290 | 0.04 |
| Type II muscle fiber area (µm2) | |||||
| Baseline | 3885 ± 278 | 4330 ± 346 | |||
| Final | 4605 ± 283 | 720 ± 285 | 4201 ± 336 | - 130 ± 336 | 0.04 |
Data are the mean ± SE of baseline and final values and of the change on each variable in each group.
Muscle Quality data calculated for all participants. Baseline and final muscle biopsies were obtained in a subset of the study population (n = 24 ST; n = 18 CON).
a Time-by-group interactions were assessed by repeated measures ANCOVA of baseline and final values for each variable adjusted for insulin therapy, change in physical activity and change in diabetes medications.
Metabolic control
As shown in Table 3, overall glycemic control (as determined by glycosylated hemoglobin A1C levels) was improved with strength training, while there was virtually no change in the CON group. Similarly, insulin resistance determined by HOMA-IR, was significantly reduced in the ST group after 16 weeks of training compared with the CON group. The change in HOMA-IR was driven by a reduction in insulin concentration in the ST group, albeit not statistically significant when compared to the CON group. In addition, serum FFA and CRP levels decreased in the ST group compared to CON subjects. Finally, circulating adiponectin concentrations increased significantly in the ST group compared with controls.
Metabolic Parameters
| ST Group | CON Group | P valuea | |||
|---|---|---|---|---|---|
| N=31 | Change | N=31 | Change | ||
| Glycosylated Hemoglobin Concentrations (%) | |||||
| Baseline | 8.7 ± 1.8 | 7.8 ± 1.6 | |||
| Final | 7.6 ± 1.5 | - 1.0 ± 0.2 | 8.3 ± 1.3 | 0.4 ± 0.3 | <0.001 |
| Glucose (mmol/L) | |||||
| Baseline | 8.8 ± 0.5 | 9.9 ± 0.7 | |||
| Final | 7.9 ± 0.4 | - 0.9 ± 0.5 | 9.5 ± 0.6 | - 0.3 ± 0.8 | 0.92 |
| Insulin (pmol/L) | |||||
| Baseline | 116 (124) | 115 (131) | |||
| Final | 105 ( 70) | - 16 (69) | 133 (126) | 6 (86) | 0.27 |
| HOMA-IR | |||||
| Baseline | 7.1 (5.7) | 6.7 (9.0) | |||
| Final | 5.3 (5.5) | - 0.7 (3.6) | 6.4 (6.8) | 0.8 (3.8) | 0.05 |
| FFA (µmol/L) | |||||
| Baseline | 656.4 ± 41.9 | 468.5 ± 38.3 | |||
| Final | 572.4 ± 45.3 | - 83.6 ± 30.3 | 612.2 ± 53 | 148.9 ± 47.7 | 0.02 |
| CRP (mg/L) | |||||
| Baseline | 3.5 (9.1) | 3.5 (8.4) | |||
| Final | 2.8 (2.8) | - 1.3 (2.9) | 4.1 (8.1) | 0.4 (2.3) | 0.05 |
| Adiponectin (µg/mL) | |||||
| Baseline | 5.1 (5.3) | 8.3 (4.5) | |||
| Final | 6.6 (5.4) | 1.0 (1.8) | 6.7 (4.6) | - 1.2 (2.2) | <0.001 |
Data are the mean ± SE or median (interquartile range) for variables not normally distributed (insulin, HOMA-IR, CRP and adiponectin) of baseline and final values and of the change on each variable in each group.
.a Time-by-group interactions were assessed by repeated measures ANCOVA of baseline and final values for each variable, adjusted for insulin therapy, change in physical activity and change in diabetes medications.
Secondary analyses
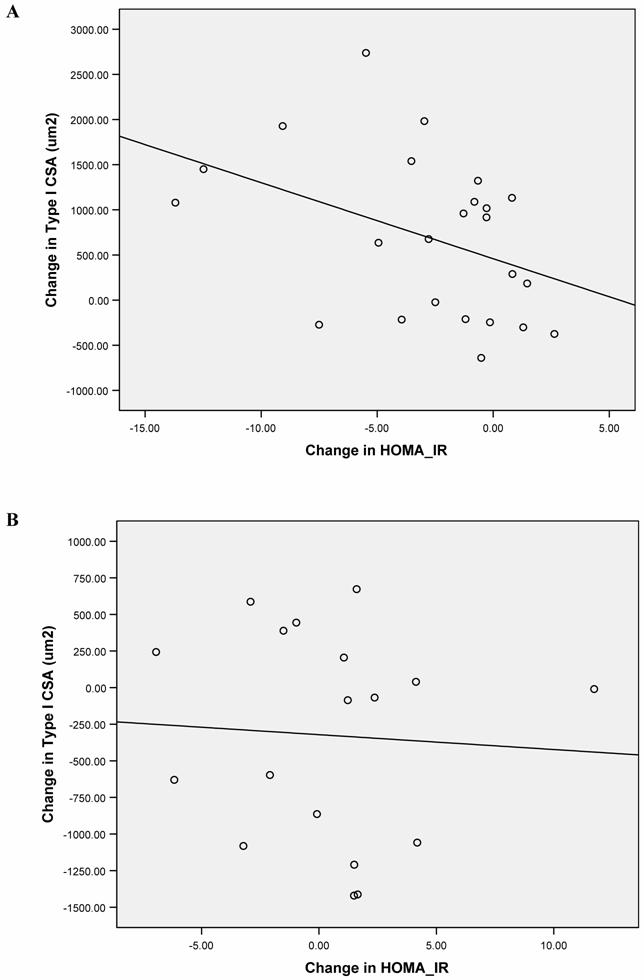
We further assessed the association of specific physiological and biochemical measures and the observed changes in type I muscle fiber CSA. Type I fibers were chosen for this analysis because they have higher insulin sensitivity, greater oxidative capacity, more mitochondria, and are more closely associated with leanness than type II fibers [32, 33]. In univariate analysis, there was a negative correlation between the changes observed in type I muscle fiber CSA and those seen for HOMA-IR in the ST group (Figure 1A) but not in the CON group (Figure 1B). This is in line with the strong inverse correlation between glycosylated hemoglobin A1C and muscle cross-sectional area observed by other investigators [17].
Univariate linear association between the absolute change in type I muscle fiber cross-sectional area and the change in HOMA-IR for each subject in the ST group (A: r= - 0.50, p=0.01) and the CON group (B: r= - 0.10, p=0.42) are shown.
There were no associations between the changes in CRP, FFA, adiponectin, lower body muscle strength or leg lean body mass and the change in type I fiber CSA for either group, nor between the changes in HOMA-IR with any of the changes observed in CRP, FFA, adiponectin levels in either group. Using multiple regression models, we found that the change in HOMA-IR was the only independent variable negatively associated with the change seen in type I muscle fiber CSA after 16 weeks of strength training, accounting for 53% of its variability (p=0.03). There were no variables significantly associated with the change in type I CSA in the CON group.
4. Discussion
Sixteen weeks of high intensity strength training resulted in increased upper and lower body strength, improved muscle quality, and muscle fiber hypertrophy. This was paralleled by favorable metabolic changes in biochemical parameters known to influence insulin sensitivity including increased adiponectin levels and decreased FFA and CRP levels. The improvements in muscle quality and metabolic control were associated with strength training in this population of community-dwelling Hispanic older adults with diabetes.
Hypertrophy of type I muscle fibers, such as that seen in the present study, is important given that these fibers are more insulin sensitive [33]; they contain a greater oxidative and mitochondria capacity, and higher capillary density [32]. Therefore, it is not surprising to find that the muscle hypertrophy resulting from strength training was associated with the increases in whole-body insulin sensitivity we observed, because skeletal muscle constitutes the target tissue where most of the insulin-stimulated glucose uptake takes place [34].
There is growing interest in muscle quality which has been demonstrated to be a predictor of health status and mortality [35, 36] and a better indicator of muscle function than strength alone [5]. Elderly individuals have reduced muscle quality compared to young adults [37], and diabetics have significantly lower muscle quality than non-diabetic controls [8]. Since in this diabetic group, those undergoing strength training significantly increased their muscle quality compared to controls, improved muscle quality and associated functional capacity derived from exercise interventions like this, may ultimately lead to increased quality of life and improved disease outcomes in people with diabetes.
We also investigated specific parameters of metabolic control known to influence insulin sensitivity, including adiponectin, CRP and FFA. Plasma adiponectin is positively associated with enhanced insulin signal transduction in skeletal muscle [38]. In the present study, subjects who strength trained showed increased levels of adiponectin. Interestingly, other studies investigating adiponectin levels have shown varying results. High intensity endurance training in nondiabetic individuals showed decreased insulin resistance and increased adiponectin levels [21]. Four weeks of endurance training increased circulating adiponectin levels and also mRNA levels of adiponectin receptors in muscle [22]. However, another recent study demonstrated that higher intensity endurance exercise provided greater increases in adiponectin, and reductions in insulin resistance in healthy elderly subjects than lower intensity exercise [23]. Our study further exemplifies this finding with high-intensity strength training in elderly diabetic individuals. It has recently been reported that insulin resistance causes a down-regulation of adiponectin receptors [10], which may be mediated by PI3-kinase/FOXO1 dependent pathway [10]. Further investigation is needed to understand the mechanisms contributing to this down-regulation of adiponectin receptors and the influence of muscle factors on circulating adiponectin levels.
The inflammatory response is correlated with multiple metabolic markers of insulin resistance. We measured CRP, a systemic marker of low-grade systemic inflammation [12]. It has recently been shown that ten months of aerobic exercise reduced CRP levels in elderly subjects [39] and aerobic exercise training combined with a dietary intervention in diabetic men reduced their CRP levels [40]. The decrease in CRP levels we observed in the present study suggests that the reduction in the inflammatory state of diabetes may be an important factor leading to improved insulin sensitivity and better metabolic control. Furthermore, since adiponectin has anti-inflammatory actions [11] and we showed a significant increase in this adipokine, the reduction in inflammation may be related to this increase.
Moreover, the positive impact of strength training on whole-body insulin resistance was demonstrated by decreased levels of plasma FFA after 16 weeks of exercise. Plasma FFA negatively influence insulin resistance and excess lipid availability leads to increased intracellular concentration of FFA and triglycerides, particularly in skeletal muscle and liver [41]. This phenomenon plays a role in the insulin resistance of skeletal muscle and also the increased plasma FFA noted in people with diabetes. The decrease in circulating FFA may be, in part due to increased fatty acid oxidation in skeletal muscle [42] and increased adiponectin levels [43]. A reduction in FFA leads to the decrease in intramuscular triglyceride levels which have found to be associated with improved insulin sensitivity [44].
This study used a randomized, high-intensity strength training program involving a large cohort of community-dwelling Hispanic older adults with poorly controlled diabetes and provided a practical means for improvement in muscle quality and better metabolic control. In addition, strength training provides a potentially more alluring means of exercise for people with type 2 diabetes, the majority of whom may be overweight and sedentary for most of their lives, and may find endurance exercise unappealing and difficult. In this study, the control subjects showed an overall worsening of the physiologic, biochemical and metabolic variables measured. This may be due to poor diabetes self-management often reported among people with diabetes or due to the socio-demographic characteristics of the study population in terms of health care use and access [45].
It is also noteworthy that at baseline subjects randomized to strength training were prescribed more insulin therapy than those in the control group. However, the beneficial effects of strength training we found were seen even in these participants, who by virtue of their insulin treatment may have been more prone to catabolic effects of diabetes and poorer glycemic control, and more resistant to the antidiabetic action of strength training. Furthermore, the results presented here were all adjusted for insulin use.
It could be argued that the euglycemic hyperinsulinemic clamp technique rather than HOMA-IR should have been used as the measure of insulin sensitivity [46]. Although the clamp technique is considered the gold standard, and a measure of choice given its precision, HOMA-IR has been tested for its comparability to the gold standard in various populations including those with diabetes [47]. Moreover, measures of plasma glucose and insulin use to derive HOMA-IR are more clinically relevant, and their changes can be followed more closely by the personal physician of an individual with diabetes.
The generalizability of these findings is limited given the selected population studied. However, long-term strength training has been shown to improve glycemic control in Caucasians [18] as well as in Hispanics [19], suggesting that the beneficial effects of this exercise modality are not population specific.
In order to investigate the mechanisms leading to improved insulin sensitivity with exercise training, it is necessary to analyze some of the components of the insulin signaling pathway in skeletal muscle. Holten et al. [48] investigated a number of important biochemical muscle adaptations in both diabetic and non-diabetic individuals in response to 4 weeks of one-legged low-intensity strength training and reported possible mechanisms leading to a training effect including increased protein content of GLUT4, insulin receptor, glycogen synthase and protein-kinase B (PKB) without an increase in muscle mass. However, they could not draw conclusive functional relevance on the changes in components of the insulin signaling protein expression. We were unable to investigate such mechanisms in the present study given the limited tissue obtained and the large variability observed in these measures provided by our study sample. Interestingly, in the Holten study they used the same subject to test one-legged strength training effect as compared to the contralateral control leg, to reduce the variation seen in these measures [48]. However, given the design of this study limited comparisons with our study can be made. Thus, further studies are warranted to establish the relationship and possible mechanisms between strength training and improved skeletal muscle insulin sensitivity. In addition, the age of participants, type of exercise training, and study design need further investigation in relation to changes in the insulin cascade, to provide more conclusive and comparable evidence.
In conclusion, the findings of the present study suggest that 16 weeks of strength training results in improved muscle quality, skeletal muscle fiber hypertrophy, accompanied by concomitant changes in biochemical markers known that contribute to whole-body insulin sensitivity; namely, reduced HOMA-IR, increased adiponectin levels and decreased FFA and CRP levels. Further studies are needed to establish the mechanisms associated with these relationships. However, these data show that strength training is an exercise modality worth considering as an adjunct of standard of care for high risk populations with diabetes.
Acknowledgements
This work was funded in part by the Brookdale Foundation, the USDA ARS agreement 58‑1950‑9‑001, the NIH General Clinical Research Center M01 RR000054, and the International Life Sciences Institute North America. Any opinions, findings, conclusions, or recommendations expressed in this publication are those of the author(s) and do not necessarily represent the views of the U.S. Department of Agriculture or any of the funding sources. We are grateful to Ms. Huynh Thanhthao for her technical assistance with muscle fiber analyses, the kind and valuable cooperation of the study participants, the GCRC and HNRCA staff, and Keiser Sports Health Equipment, Inc. Dr. Carmen Castaneda is a recipient of a Brookdale National Fellowship.
References
1. Zierath JR, Krook A, Wallberg-Henriksson H. Insulin action and insulin resistance in human skeletal muscle. Diabetologia. 2000 ;43:821-35
2. Turner RC, Millns H, Neil HA. et al. Risk factors for coronary artery disease in non-insulin dependent diabetes mellitus: United Kingdom Prospective Diabetes Study (UKPDS: 23). BMJ. 1998 ;316:823-8
3. Castaneda C, Bermudez OI, Tucker KL. Protein nutritional status and function are associated with type 2 diabetes in Hispanic elders. Am J Clin Nutr. 2000 ;72:89-95
4. Wallberg-Henriksson H, Rincon J, Zierath JR. Exercise in the management of non-insulin-dependent diabetes mellitus. Sports Med. 1998 ;25:25-35
5. Dutta C. Significance of sarcopenia in the elderly. J Nutr. 1997 ;127:992S-3S
6. Dutta C. Commentary on "Effects of strength training and detraining on muscle quality: Age and gender comparisons". Journal of Gerontology. 2000 ;55A:B158-B9
7. Lynch NA, Metter EJ, Lindle RS. et al. Muscle quality. I. Age-associated differences between arm and leg muscle groups. J Appl Physiol. 1999 ;86:188-94
8. Park SW, Goodpaster BH, Strotmeyer ES. et al. Decreased muscle strength and quality in older adults with type 2 diabetes: the health, aging, and body composition study. Diabetes. 2006 ;55:1813-8
9. Whitehead JP, Richards AA, Hickman IJ, Macdonald GA, Prins JB. Adiponectin--a key adipokine in the metabolic syndrome. Diabetes Obes Metab. 2006 ;8:264-80
10. Tsuchida A, Yamauchi T, Ito Y. et al. Insulin/Foxo1 pathway regulates expression levels of adiponectin receptors and adiponectin sensitivity. J Biol Chem. 2004 ;279:30817-22
11. Chandran M, Phillips SA, Ciaraldi T, Henry RR. Adiponectin: more than just another fat cell hormone? Diabetes Care. 2003 ;26:2442-50
12. Ouchi N, Kihara S, Funahashi T. et al. Reciprocal association of C-reactive protein with adiponectin in blood stream and adipose tissue. Circulation. 2003 ;107:671-4
13. Florez H, Castillo-Florez S, Mendez A. et al. C-reactive protein is elevated in obese patients with the metabolic syndrome. Diabetes Res Clin Pract. 2006 ;71:92-100
14. Maiorana A, O'Driscoll G, Goodman C, Taylor R, Green D. Combined aerobic and resistance exercise improves glycemic control and fitness in type 2 diabetes. Diabetes Res Clin Pract. 2002 ;56:115-23
15. Cauza E, Hanusch-Enserer U, Strasser B. et al. The relative benefits of endurance and strength training on the metabolic factors and muscle function of people with type 2 diabetes mellitus. Arch Phys Med Rehabil. 2005 ;86:1527-33
16. Tokmakidis SP, Zois CE, Volaklis KA, Kotsa K, Touvra AM. The effects of a combined strength and aerobic exercise program on glucose control and insulin action in women with type 2 diabetes. Eur J Appl Physiol. 2004 ;92:437-42
17. Eriksson J, Taimela S, Eriksson K, Parviainen S, Peltonen J, Kujala U. Resistance training in the treatment of non-insulin-dependent diabetes mellitus. Int J Sports Med. 1997 ;18:242-6
18. Dunstan DW, Daly RM, Owen N. et al. High-intensity resistance training improves glycemic control in older patients with type 2 diabetes. Diabetes Care. 2002 ;25:1729-36
19. Castaneda C, Layne JE, Munoz-Orians L. et al. A randomized controlled trial of resistance exercise training to improve glycemic control in older adults with type 2 diabetes. Diabetes Care. 2002 ;25:2335-41
20. Castaneda C, Gordon PL, Parker RC, Uhlin KL, Roubenoff R, Levey AS. Resistance training to reduce the malnutrition-inflammation complex syndrome of chronic kidney disease. Am J Kidney Dis. 2004 ;43:607-16
21. Marcell TJ, McAuley KA, Traustadottir T, Reaven PD. Exercise training is not associated with improved levels of C-reactive protein or adiponectin. Metabolism. 2005 ;54:533-41
22. Bluher M, Bullen JW Jr, Lee JH. et al. Circulating adiponectin and expression of adiponectin receptors in human skeletal muscle: associations with metabolic parameters and insulin resistance and regulation by physical training. J Clin Endocrinol Metab. 2006 ;91:2310-6
23. Fatouros IG, Tournis S, Leontsini D. et al. Leptin and adiponectin responses in overweight inactive elderly following resistance training and detraining are intensity related. J Clin Endocrinol Metab. 2005 ;90:5970-7
24. American Diabetes Association. Standards of medical care for patients with diabetes mellitus. Diabetes Care. 2002 ;25:S33-S49
25. Clasey JL, Hartman ML, Kanaley J. et al. Body composition by DEXA in older adults: accuracy and influence of scan mode. Med Sci Sports Exerc. 1997 ;29:560-7
26. Wang ZM, Visser M, Ma R. et al. Skeletal muscle mass: evaluation of neutron activation and dual-energy X-ray absorptiometry methods. J Appl Physiol. 1996 ;80:824-31
27. Evans WJ, Phinney SD, Young VR. Suction applied to a muscle biopsy maximizes sample size. Medicine and Science in Sport and Exercise. 1982 ;14:101-2
28. Castaneda C, Gordon PL, Fielding RA, Evans WJ, Crim MC. Marginal protein intake results in reduced plasma IGF-I levels and skeletal muscle fiber atrophy in elderly women. J Nutr Health Aging. 2000 ;4:85-90
29. Emoto M, Nishizawa Y, Maekawa K. et al. Homeostasis model assessment as a clinical index of insulin resistance in type 2 diabetic patients treated with sulfonylureas. Diabetes Care. 1999 ;22:818-22
30. Washburn RA, Smith KW, Jette AM, Janney CA. The Physical Activity Scale for the Elderly (PASE): development and evaluation. J Clin Epidemiol. 1993 ;46:153-62
31. Tucker KL, Maras J, Bermudez OI. Adapting a food frequency questionnaire to assess diets of Puerto Rican and Non-Hispanic adults. Am J Epidemiol. 1998 ;148:507-18
32. Kelley DE, Goodpaster BH, Storlien L. Muscle triglyceride and insulin resistance. Annu Rev Nutr. 2002 ;22:325-46
33. James DE, Jenkins AB, Kraegen EW. Heterogeneity of insulin action in individual muscles in vivo: euglycemic clamp studies in rats. Am J Physiol. 1985 ;248:E567-74
34. DeFronzo RA, Ferrannini E, Sato Y, Felig P, Wahren J. Synergistic interaction between exercise and insulin on peripheral glucose uptake. J Clin Invest. 1981 ;68:1468-74
35. Newman AB, Haggerty CL, Goodpaster B. et al. Strength and muscle quality in a well-functioning cohort of older adults: the Health, Aging and Body Composition Study. J Am Geriatr Soc. 2003 ;51:323-30
36. Newman AB, Kupelian V, Visser M. et al. Strength, but not muscle mass, is associated with mortality in the health, aging and body composition study cohort. J Gerontol A Biol Sci Med Sci. 2006 ;61:72-7
37. Metter EJ, Lynch N, Conwit R, Lindle R, Tobin J, Hurley B. Muscle quality and age: cross-sectional and longitudinal comparisons. J Gerontol A Biol Sci Med Sci. 1999 ;54:B207-18
38. Stefan N, Vozarova B, Funahashi T. et al. Plasma adiponectin concentration is associated with skeletal muscle insulin receptor tyrosine phosphorylation, and low plasma concentration precedes a decrease in whole-body insulin sensitivity in humans. Diabetes. 2002 ;51:1884-8
39. Kohut ML, McCann DA, Russell DW. et al. Aerobic exercise, but not flexibility/resistance exercise, reduces serum IL-18, CRP, and IL-6 independent of beta-blockers, BMI, and psychosocial factors in older adults. Brain Behav Immun. 2006 ;20:201-9
40. Roberts CK, Won D, Pruthi S, Lin SS, Barnard RJ. Effect of a diet and exercise intervention on oxidative stress, inflammation and monocyte adhesion in diabetic men. Diabetes Res Clin Pract. 2006 ;73:249-59
41. Saltiel AR. New perspectives into the molecular pathogenesis and treatment of type 2 diabetes. Cell. 2001 ;104:517-29
42. Yamauchi T, Kamon J, Waki H. et al. The fat-derived hormone adiponectin reverses insulin resistance associated with both lipoatrophy and obesity. Nat Med. 2001 ;7:941-6
43. Pittas AG, Joseph NA, Greenberg AS. Adipocytokines and insulin resistance. J Clin Endocrinol Metab. 2004 ;89:447-52
44. Boden G, Shulman GI. Free fatty acids in obesity and type 2 diabetes: defining their role in the development of insulin resistance and beta-cell dysfunction. Eur J Clin Invest. 2002 ;32(Suppl 3):14-23
45. Smedley BD, Stith AY, Nelson AR. Unequal treatment: confronting racial and ethnic disparities in health care. Washington, DC: National Academy Press. 2002
46. Matthews DR, Hosker JP, Rudenski AS, Naylor BA, Treacher DF, Turner RC. Homeostasis model assessment: insulin resistance and beta-cell function from fasting plasma glucose and insulin concentrations in man. Diabetologia. 1985 ;28:412-9
47. Haffner SM, Miettinen H, Stern MP. The homeostasis model in the San Antonio Heart Study. Diabetes Care. 1997 ;20:1087-92
48. Holten MK, Zacho M, Gaster M, Juel C, Wojtaszewski JF, Dela F. Strength training increases insulin-mediated glucose uptake, GLUT4 content, and insulin signaling in skeletal muscle in patients with type 2 diabetes. Diabetes. 2004 ;53:294-305
Author contact
![]() Correspondence to: Carmen Castaneda-Sceppa, M.D., Ph.D., Tufts University, 711 Washington St.; Boston, MA 02111. Telephone (617) 556-3081 Fax (617) 556-3083 E-mail carmen.sceppaedu
Correspondence to: Carmen Castaneda-Sceppa, M.D., Ph.D., Tufts University, 711 Washington St.; Boston, MA 02111. Telephone (617) 556-3081 Fax (617) 556-3083 E-mail carmen.sceppaedu