Impact Factor ISSN: 1449-1907

 Global reach, higher impact
Int J Med Sci 2006; 3(3):84-91. doi:10.7150/ijms.3.84 This issue Cite
Research Paper
Skeletal muscle sodium glucose co-transporters in older adults with type 2 diabetes undergoing resistance training
Francisco Castaneda1, Jennifer E. Layne2, Carmen Castaneda2 ![]()
1. Max Planck Institute for Molecular Physiology, Dortmund, Germany.
2. Nutrition, Exercise Physiology and Sarcopenia Laboratory, Jean Mayer U.S. Department of Agriculture (USDA) Human Nutrition Research Center on Aging, Tufts University, Boston, MA, USA.
Received 2006-4-10; Accepted 2006-5-16; Published 2006-5-17
Abstract
We examined the expression of the sodium-dependent glucose co-transporter system (hSGLT3) in skeletal muscle of Hispanic older adults with type 2 diabetes. Subjects (65±8 yr) were randomized to resistance training (3x/wk, n=13) or standard of care (controls, n=5) for 16 weeks. Skeletal muscle hSGLT3 and GLUT4 mRNA transcript levels were determined by real time RT-PCR. hSGLT3 transcripts increased by a factor of ten following resistance training compared to control subjects (0.10, P=0.03). There were no differences in GLUT4 mRNA expression levels between groups. Protein expression levels of these transporters were confirmed by immunohistochemistry and Western blotting. hSGLT3 after resistance exercise was found not to be co-localized with the nicotinic acetylcholine receptor. The change in hSGLT3 transcript levels in the vastus lateralis muscle was positively correlated with glucose uptake, as measured by the change in muscle glycogen stores (r=0.53, P=0.02); and with exercise intensity, as measured by the change in muscle strength (r=0.73, P=0.001). Group assignment was be the only independent predictor of hSGLT3 transcript levels, explaining 68% of its variability (P=0.01). Our data show that hSGLT3, but not GLTU4, expression was enhanced in skeletal muscle after 16 weeks of resistance training. This finding suggests that hSGLT3, an insulin-independent glucose transporter, is activated with exercise and it may play a significant role in glycemic control with muscle contraction. The hSGLT3 exact mechanism is not well understood and requires further investigation. However its functional significance regarding a reduction of glucose toxicity and improvement of insulin resistance is the subject of ongoing research.
Keywords: SGLT co-transport, diabetes, resistance training
1. Introduction
Diabetes mellitus has a high incidence worldwide. The International Diabetes Federation estimates that at least 177 million people in the world have diabetes. Approximately 90-95% of people who are diagnosed with diabetes have type 2 diabetes. It results from insulin resistance combined with relative insulin deficiency [1]. Both insulin resistance and deficiency leads to hyperglycemia due to altered glucose transport into the cells. Cellular glucose uptake requires transport proteins because it does not freely permeate the plasma membrane [2]. Glucose transport proteins are divided in two groups: glucose facilitated transporters (GLUT) and sodium dependent D-glucose co-transporters (SGLT). GLUT allows transport of glucose down its concentration gradient, while SGLT transports glucose against its concentration gradient.
The causes of type 2 diabetes are numerous and complex, but physical inactivity is an important factor. Exercise, the major physiological activator of muscle glucose transport, regulates the expression of GLUT4 in skeletal muscle [3, 4], and induces its translocation from the intracellular pool to the plasma membrane [5, 6]. However, sustained insulin deficiency leads to a decreased number of GLUT4 transporters, resulting in impaired responsiveness of glucose transport to both insulin and exercise [4, 7]. People with type 2 diabetes have been shown to have defective insulin-dependent glucose transport in skeletal muscle [8]. This is of concerned given that skeletal muscle plays an important role in glucose homeostasis, primarily due to its effect on postprandial glucose uptake [9].
The sodium-dependent D-glucose co-transport system is mainly expressed in skeletal muscle [10]. It was first described as SAAT-pSGLT2 due to its similarities with other components of the SGLT2 system in the kidney of pigs [9]. It has been renamed hSGLT3 after finding it in human DNA sequence of chromosome 22, and is considered a member of the SLC5 gene family [11]. Secondary active transport of glucose across the muscle membrane via hSGLT3 represents an insulin-independent form of glucose uptake [2]. Currently, there are no studies investigating the association between the expression of hSGLT3 and exercise. However, molecular targets of anti-diabetic drugs are using SGLT inhibitors as a promising agent [12].
Resistance exercise is the only non-pharmacological modality known to increase muscle mass [13]. We have shown that progressive resistance training improves glycemic and metabolic control among high-risk older adults with type 2 diabetes [14]. Research on the effects of exercise-induced glucose disposal implicates the role of enhanced GLUT4 transport system [15]. However, there are no published studies examining the relationship between the expression of hSGLT3 and resistance exercise training. Therefore, we undertook this pilot investigation based on the hypothesis that older adults with uncontrolled diabetes (poor glycemic control and sustained hyperglycemia) engaged in resistance exercise training for 16 weeks, would exhibit improved glycemic control associated with enhanced expression and synthesis of hSGLT3 in skeletal muscle. If in fact exercise training increases SGLT-mediated glucose transport, the novel findings of this investigation would provide preliminary information on a possible physiological target to be studied further for the management of type 2 diabetes.
2. Methods
Experimental subjects and training program
Sixty-two community-dwelling Hispanic men and women over 55 years of age with type 2 diabetes were randomized to 16 weeks of standard care (control group) or standard care plus progressive resistance training (RT group) as previously described [14]. Hispanic subjects were chosen because of their high likelihood of having poor glycemic control. Eligible subjects gave written informed consent approved by the Institutional Review Board at Tufts-New England Medical Center. For the present study, a subset of 18 subjects (RT, n=13 and Controls, n=5) who agreed to have a muscle biopsy were studied.
Subjects randomized to resistance training exercised at the Jean Mayer USDA Human Nutrition Research Center on Aging (HNRCA) at Tufts University 3 times per week under supervision. The exercise sessions consisted of a 5-min warm-up, 35-min exercise using 2 upper and 3 lower body pneumatic resistance training machines, and a 5-min cool-down. Training began at 60-65% of one repetition maximum (1RM) and progressed to 75-80% of 1RM by the end of the first 4 weeks. 1RM was reassessed at weeks 8 and 16, and the workload adjusted accordingly. Control subjects received phone calls every other week and came to the HNRCA for testing during baseline, mid- and post-study [14].
Outcome Measures
Baseline measures were taken prior to randomization. Biochemical measurements were collected in the fasting state. All study measures were carried out in a blinded fashion with the exception of muscle strength.
hSGLT3 and GLUT4 gene expression
RNA Extraction
Skeletal muscle samples were obtained in the non-dominant vastus lateralis muscle by percutaneous needle biopsy using a 5 mm Bergstrom needle [16] at baseline and 72 h after final strength testing. Approximately, 20 mg were homogenized using a polytron homogenizer (Tissue Tearor, BioSpec Products, Inc., Bartlesville, OK) in a mono-phase solution of phenol and guanidine thiocyanate (TRI-Reagent, Molecular Research Center, Cincinnati, OH). Total RNA was extracted per manufacturer's instructions. To ensure removal of genomic DNA contaminants, samples were subjected to RNase-free DNase for on-column DNase digestion (QIAGEN Inc, Valencia, CA). DNA-free RNA was eluted using diethylpyrocarbonate-treated water. Total RNA concentrations were determined spectrophotometrically.
Quantitative real-time reverse transcription-polymerase chain reaction (RT-PCR)
The expressions of hSGLT3 and GLUT4 before and after the intervention were determined by relative quantitative real time PCR. Specific primers for real time PCR were designed using the software PrimerExpress (Applied Biosystems, Darmstadt, Germany) and obtained from MWG-Biotech AG (Ebersberg, Germany). The primers for hSGLT3 were: (forward) 5'-TAG CTG AGA CCC CAG AGC CA-3') and (reverse) 5'-CAG CAT TTC GGA TGT GGT CA-3'. The primers for GLUT4 were: (forward) 5'-CTC ATT GGC GCC TAC TCA GG-3' and (reverse 5'-CAC GTA CAT GGG CAC CAG C-3'. Real time PCR was performed in an ABI PRISM GeneAmp® 5700 sequence detection system (Applied Biosystems) using one-step QuantiTect SYBR green RT-PCR kit (Qiagen, Hilden, Germany). Gene expression 16 weeks after the intervention was evaluated against baseline. For normalization the housekeeping gene GADPH was applied as a reference gene. The primers for GADPH were: (forward) 5'-CAA GGT CAT CCC TGA CGT GAA-3' and (reverse) 5'-CAG GTC CAC CAC TGA CAG GT-3'. The analysis of relative real time RT-PCR quantification was obtained using the threshold cycle (CT) values and calculated by the Delta-Delta Ct method and converted to relative expression ratio (2-ΔΔCt) for statistical analysis [17, 18]. The efficiency of PCR amplification for hSGLT3, GLUT4 and GAPDH was confirmed in a series of validation studies prior to quantitation. Melting temperature curves were used to evaluate the specificity of the amplification products.
hSGLT3 and GLUT4 protein expression
Immunohistochemistry
Ten-micron tissue cryosections of the vastus lateralis muscle specimens obtained before and after the 16-week intervention were mounted onto Plus-Superfrost slides (VWR International, Vienna, Austria). The slides were rinsed with phosphate buffer solution (PBS) + 0.3% Triton-X100 + 0.1% bovine serum albumin (BSA) at room temperature. Subsequently, cryosections were first blocked (30 min) with PBS containing 0.3% milk powder and then rinsed with PBS + 0.3% Triton-X100 + 0.1% BSA for 15 min. The slides were then incubated with primary antibody directed against SGLT3 (QIS30, 1:100 in PBS + 1% BSA + 3% milk powder) or against GLUT4 (ab654, Acris, Hiddenhausen, Germany). QIS30 –amino acids 243-272, is a polyclonal rabbit antiserum against SGLT synthesized in our laboratory [19]. This sequence is an epitope homologous in rabbit SGLT1 and in human SGLT3, as confirmed by the Genetics Computer Group (GCG) software program version 9.0 (Accelrys, Cambridge, UK). Cy3-conjugated donkey anti-rabbit IgG antibody (1:500, Jackson ImmunoResearch) in PBS + 1% BSA + 3% milk powder for 60 min at room temperature was used as a second antibody. Cell nuclei were counterstained with a 4-,6-diamidino-2-phenylindole (DAPI) solution (1:40000 in PBS). For co-localization studies of hSGLT3 and the nicotinic acetylcholine receptor we used QIS30 and a mouse monoclonal antibody (ab11151, Acris), respectively. As a second antibody we used FITC conjugated goat anti-rabbit IgG (1:100, Sigma) for SGLT3 and Alexa Fluor 555-conjugated anti-mouse IgG (1:100, Invitrogen) for the nicotinic acetylcholine receptor. Immunohistochemical analyses were performed by fluorescence microscopy.
Western Blotting
Western blotting was performed using the single section Western blot (SSWB) method described by Cooper [20] and normalized to GAPDH. Detection was performed using the ECL Western Blot Detection Kit (PerkinElmer, Rodgau-Jügesheim, Germany). Bands were quantified using Scion Image software for Windows (NIH, Bethesda, USA). Briefly, muscle biopsy cryosections (10 µm thickness, 10 mm2 cross-sectional area) were solubilized using SSWB-lysis buffer containing 4% SDS, 125 mM Tris pH 8.8, 40% glycerol, 0.5 mM phenylmethylsulfonyl fluoride, 100 mM dithiothreitol, and bromophenol blue. Samples were sonicated, heated to 94 °C for 4 minutes, and briefly spun (3 min, 15,000 g) before loading. Protein concentration was measured by absorption measurement at 280 nm using a BioPhotometer method (Eppendorf, Hamburg, Germany). Twenty µL muscle lysate was loaded per lane and electrophoresed on 4 to 12% gradient SDS-PAGE gels (Invitrogen, Karlsruhe, Germany) at 30 to 35 mA constant current overnight onto 0.45 µm PVDF membranes (Millipore Corp., Bedford, MA). Then, the PVDF membranes were blotted with QIS30, anti GLUT4 or anti GAPDH (CSA-335, Stressgen, Victoria, Canada) at 1:2,000 in PBS + Tween 20 + 2% BSA for 1 hr at room temperature. Bound anti-QIS30 and GLUT4 was detected using donkey anti-rabbit-IgG conjugated to horseradish peroxidase (1:2000 in PBS + Tween 20 + 2% BSA) for 1 hr at room temperature, and anti-GAPDH was detected using anti-mouse IgG (Sigma).
Muscle glycogen
Muscle glycogen stores (a surrogate of glucose disposal) were determined by hexokinase enzymatic and spectrophotometric analyses (Sigma Diagnostics, St. Louis, MI) with a C.V. of 5% [21].
Muscle Strength
One repetition maximum (1RM) was assessed twice on each machine at baseline (prior to randomization), and once at 16 weeks. Baseline and final muscle strength was calculated as the sum of 1RM measures for all machines used for training.
Statistical analysis
Statistical analysis was performed using SPSS 12.0 for Windows (SPSS, Inc., Evanston, IL). Results were statistically significant if the 2-tailed p-value was less than 0.05. Variables were checked for normality. Non-normally distributed variables were log-transformed, checked for normality after log transformation, and used as continuous log-transformed variables for analyses. Data are shown as mean and standard deviation (SD) or median for non-normally distributed variables. Baseline comparisons were assessed by independent sample t-test or Chi-square as appropriate. To test the significance of resistance training in predicting main (hSGLT3 and GLUT4 gene and protein expression levels) and secondary (muscle glycogen stores and muscle strength) study outcomes, analysis of covariance of the absolute change (week 16 – week 0) in each outcome variable was carried out adjusted for age, gender and years with diabetes when appropriate. Secondary, stepwise multiple regression analysis was performed to determine independent predictors of the change in hSGLT3. Independent predictive variables were chosen based on their statistically significant association with main outcomes at baseline, as determined by univariate analysis using Pearson's correlation coefficient. These variables were the changes in lean body mass and muscle strength (referring to training intensity) as well as the change in muscle glycogen stores (surrogate for glucose disposal). Group assignment was forced into the model.
3. Results
Subject Characteristics
As shown in Table 1, subjects in this study were on average obese, older and with uncontrolled, long-term type 2 diabetes.
Baseline Subject Characteristics
| Resistance Training (N=13) | Control (N=5) | P-value * | |
|---|---|---|---|
| Age (yr) | 66 ± 8 | 60 ± 4 | 0.17 |
| Sex (women/men) | 9/4 | 3/2 | 0.63 |
| Body Mass Index (kg/m2) | 32.1 ± 6.8 | 33.4 ± 6.3 | 0.28 |
| Year with Diabetes (y) | 8 ± 6 | 10 ± 6 | 0.99 |
| Glycosylated Hemoglobin (%) | 8.6 ± 1.8 | 8.1 ± 1.2 | 0.41 |
| Fasting Blood Glucose (mg/dL) | 147 ± 35 | 147 ± 30 | 0.63 |
Data are means ± SD
Baseline comparisons between groups were assessed using independent sample t-test comparisons for continuous and log transformed variables, while Chi-square was used for categorical variables.
hSGLT3 and GLUT4 gene expression
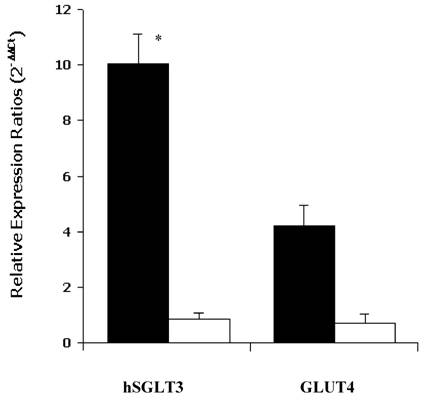
As shown in Figure 1, the median relative expression ratio (2-ΔΔCt) of hSGLT3 transcript levels in skeletal muscle increased by a factor of 10.02 after 16 weeks of progressive resistance exercise training compared to control subjects (0.10, P = 0.03). In contrast, there were no differences in GLUT4 transcript levels between groups. The latter corresponded to median values of 0.86 and 0.70 after the 16-week study, for the exercise and control groups, respectively (NS). The expression of hSGLT3 and GLUT4 was confirmed by melting temperature (Tm) analysis. The obtained temperature for hSGLT3, GLUT4 and GADPH were 72°C, 80°C and 82°C, respectively.
Median relative expression ratios (2-ΔΔCt) for hSGLT3 and GLUT4 transcript levels in skeletal muscle after 16 weeks of resistance training are shown for exercise (shaded bars) and control (open bars) subjects. Error bars represent SD. * P = 0.03, difference between groups.
hSGLT3 and GLUT4 protein expression
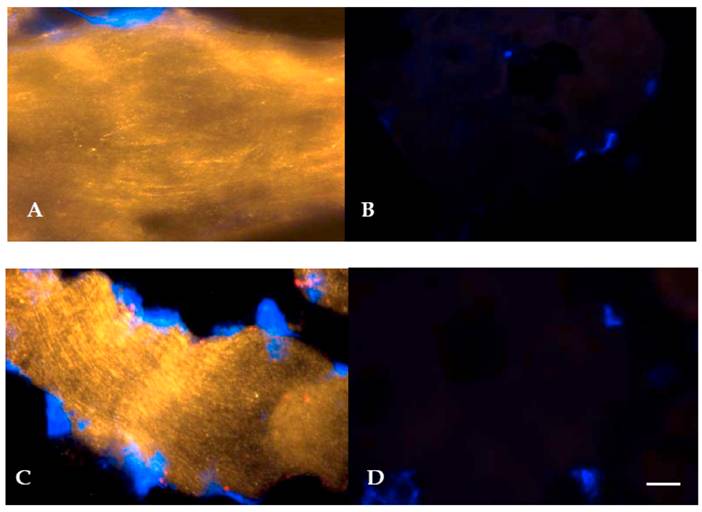
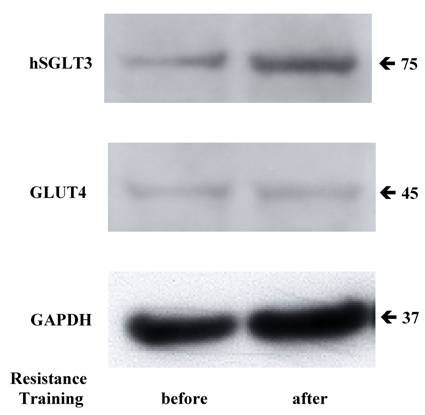
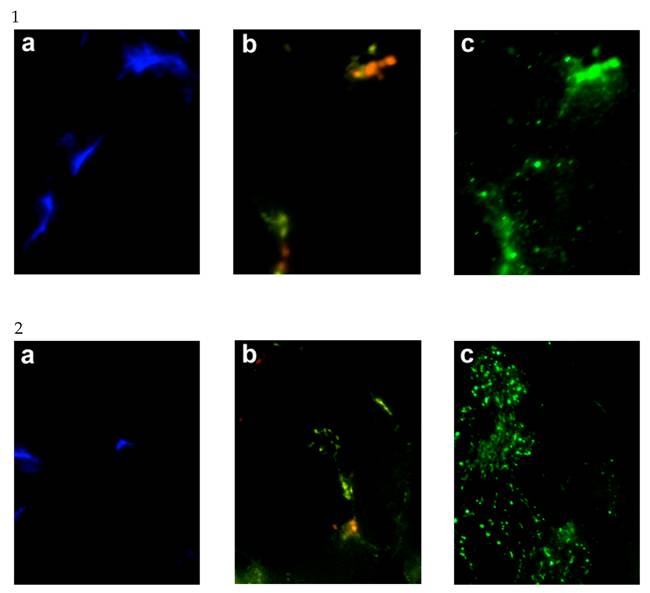
Given the elevation in hSGLT3 transcript levels we observed with 16 weeks of resistance training, we further determined the expression of hSGLT3 and GLUT4 at the protein level by immunohistochemical detection (Figure 2) and Western blotting (Figure 3) only in subjects randomized to exercise. This confirmatory step could only be done in a small sample of exercise subjects (n=5) for whom skeletal muscle tissue was available. Figure 2 shows the immunohistochemical determination of hSGLT3 in skeletal muscle before (Figure 2A) and after 16 weeks of resistance exercise training (Figure 2C). hSGLT3 protein fluorescence detection levels increased with exercise, as shown by the presence of a diffuse pattern with a marked increase in the sarcolemma compared to that observed before training, suggesting that resistance exercise increased the expression of SGLT3 in the cell membrane. GLUT4 protein expression levels did not change with exercise (data not shown), confirming the observation obtained by gene expression. To further confirm the qualitative measures of protein expression using immunohistochemical analysis, we determine the quantity of protein expression by Western blotting of the same tissue samples for the exercise subjects. As shown in Figure 3, hSGLT3 but not GLUT4 protein was abundant in the cell membrane of the vastus lateralis muscle after 16 weeks of resistance exercise training with GAPDH as the reference protein. These corresponded to mean densitometric values of 145 and 10, for hSGLT3 and GLUT4, respectively. To further evaluate the role of hSGLT3, we determined its co-localization with the nicotinic acetylcholine receptor before and after resistance exercise training using specific antibodies (Figure 4). As expected, before exercise, the nicotinic acetylcholine receptor (Figure 4.1.b) and the hSGLT3 (Figure 4.1.c) immunoreactivity co-localized near the nuclei. After 16 weeks of resistance training, the nicotinic acetylcholine receptor (Figure 4.2.b) and hSGLT3 (Figure 4.2.c) were not co-localized and furthermore, hSGLT3 immunoreactivity was increased compared to baseline.
Representative immunohystochemical staining of vastus lateralis muscle tissue (longitudinal section, 40X magnified) using specific antibodies against hSGLT3 (QIS30: yellow; A, before; and C, after 16 weeks of resistance exercise) and without primary antibody (B, before; and D, after exercise). Cell nuclei were counterstained with DAPI (blue). Scale bar is 10 μm.
Representative Western blotting for hSGLT3, GLUT4 and GAPDH are shown before and after 16 weeks of resistance exercise training.
Representative immunohystochemical staining of the vastus lateralis muscle tissue (transversal section, 40X magnified) before (1.a,b,c) and after (2.a,b,c) exercise. Specific antibodies against the nuclei were stained with DAPI (Figures “a” shown in blue), the nicotinic acetylcholine receptor gamma (Figures “b” shown in yellow), and hSGLT3 (Figures “c” shown in green).
Muscle Glycogen Stores
Sixteen weeks of moderate-to-high intensity resistance training (3x/week) resulted in improved glucose disposal as measured by skeletal muscle glycogen stores. In the exercise group, muscle glycogen increased by 44% (from 60.2 ± 16.9 to 83.2 ± 21.8 mmol glucose/kg muscle, before and after exercise, respectively). In contrast, control subjects showed a mean reduction in muscle glycogen equivalent to 13% (from 66.7 ± 10.4 to 57.7 ± 21.4 mmol glucose/kg muscle, P = 0.04 vs. exercisers). Analysis of covariance was adjusted for age, gender and years with diabetes. Of note it is important to mention that fasting plasma glucose did not change between groups as previously reported [14]. This is not surprising given that the role of skeletal muscle in glucose homeostasis is primarily related to postprandial effects of glucose uptake, namely glycogen stores.
Muscle Strength
Mean training intensity was 70.2 ± 1.3 % of 1RM (range: 66 to 75 %). Exercisers gained on average 43 ± 29% of whole-body muscle strength, as compared to a 19 ± 31% loss in control subjects (P = 0.01). This analysis was adjusted for age, gender and years with diabetes.
Secondary Analysis of Predictors of the Change in Main Outcomes
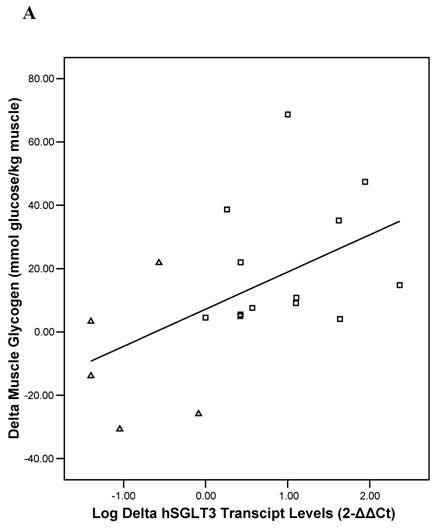
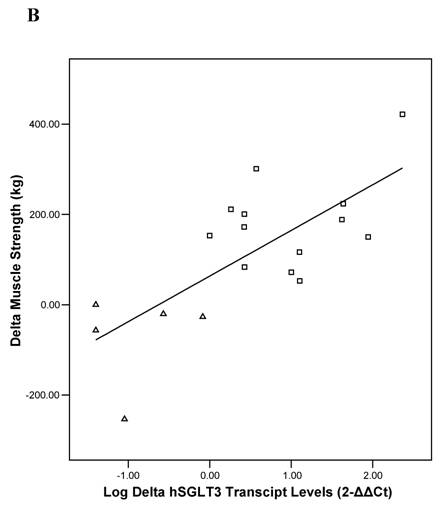
Baseline univariate correlation analyses showed that hSGLT3 transcript levels were positively related with baseline values for lean body mass (r = 0.37), muscle strength (r = 0.53), and skeletal muscle glycogen stores (r = 0.51), all coefficients of correlation were significant at P < 0.05. In addition, the change in hSGLT3 transcript levels was directly correlated with the changes seen in muscle glycogen stores –or glucose disposal (r = 0.53, P = 0.02; Figure 5A) and with the changes in muscle strength (r = 0.73, P = 0.001; Figure 5B). Given the positive associations between muscle mass and strength (a function of exercise intensity), and muscle glycogen (surrogate for glucose disposal), we used these as independent variables in multivariate analysis to determine predictors of the change in hSGLT3. This analysis showed that group assignment was the only significant predictor of the change in hSGLT3 transcript levels, accounting for 68% of its variance (P = 0.01).
Pearson's correlation analysis between the absolute change (delta: week 16- week 0) in the relative expression ratio (2-ΔΔCt) of hSGLT3 transcript levels and the delta in muscle glycogen stores (A) and in muscle strength (B), are shown for each subject in the resistance training (squares) and the control (triangles) group. These figures show log-transformed hSGLT3 transcript levels.
4. Discussion
This study shows that individuals with uncontrolled type 2 diabetes (characterized by poor glycemic control and sustained hyperglycemia), undergoing moderate to high intensity resistance exercise training for 16 weeks, exhibit a significant increase in sodium-dependent D-glucose co-transporter (hSGLT3) transcript and protein levels in skeletal muscle tissue. To our knowledge, this is the first study to examine the associations between hSGLT3 expression and glycemic control in human subjects subjected to resistance exercise training. A concomitant increase in glucose disposal (muscle glycogen stores) and muscle strength were observed with resistance training. Moreover, the observed increase expression in hSGLT3 was significantly associated with improved glycemic control and functional capacity.
We hypothesized that the expression of hSGLT3 in skeletal muscle would be correlated with improved glycemic control in a high-risk population of Hispanic older adults with poor diabetes control and glucose toxicity. At baseline, study subjects had poor glycemic control as shown by glycosylated hemoglobin concentrations over 8%, similar to those reported among individuals with diabetes in the Third National Health and Nutrition Examination Survey (NHANES III) [22]. Optimal glycemic control represents the main challenge in diabetes management [23]. Exercise is a beneficial intervention for diabetes control [24]. Studies of glucose intolerant and diabetic subjects have demonstrated that increased physical activity enhances insulin sensitivity and insulin-dependent glucose uptake in skeletal muscle by regulating the expression of GLUT4 transporters [25-27]. However, there are no studies examining the effect of physical activity on hSGLT3 mediated glucose uptake.
GLUT4 is expressed exclusively in insulin-sensitive tissues (e.g. muscle, fat and heart) and is predominantly localized in intracellular vesicles [28]. GLUT4 translocates from the intracellular vesicle storage to the sarcolemma in response to exercise and/or insulin action. Thus, insulin-dependent glucose uptake may be explained by translocation of GLUT4 transporters to the sarcolemma [29, 30]. However, type 2 diabetes is characterized by insulin resistance, and thus the inability of insulin to stimulate glucose utilization in skeletal muscle. It has been proposed that insulin resistant individuals have a defect in GLUT4 trafficking and targeting leading to reduced GLUT4 in the cell membrane in skeletal muscle [31]. However, there is evidence to suggest different intracellular signaling pathways that lead to insulin- and exercise-stimulated GLUT-4 translocation. Namely, insulin utilizes a phosphatidylinositol 3-kinase-dependent mechanism, whereas exercise signaling may be initiated by calcium release from the sarcoplasmic reticulum leading to the activation of other signaling intermediaries. There is also evidence for an autocrine- or paracrine-mediated activation of glucose transport [32].
Our findings suggest an insulin-independent mechanism for glucose uptake with resistance training. We found that hSGLT3 protein expression levels after 16 weeks of progressive resistance exercise training were localized preferentially in the plasma membrane of muscle fibers, as demonstrated by immunohistochemistry. In contrast, we did not find a significant increase in GLUT4 expression after resistance training. This finding was also confirmed by immunohistochemistry, showing GLUT4 containing vesicles without increased localization of GLUT4 in the plasma membrane. Therefore, our results seem to indicate that intracellular GLUT4 remained preferentially in vesicle storage without being translocated into the sarcolemma.
The preliminary findings of this investigation, as they relate to hSGLT3 transport with resistance training are provocative and require further investigation. The only published study about human SGLT3 we were able to find showed, using functional studies of the Xenopus laevis oocyte expression system, that hSGLT3 was incapable of sugar transport even though it was efficiently inserted into the plasma membrane. The authors concluded that hSGLT3 is not a sodium-glucose co-transporter but instead a glucose sensor in the plasma membrane of skeletal muscle fibers [33, 34]. Although Xenopus laevis oocytes is the most used expression model system for characterization of SGLT, the expressed hSGLT3 could be functionally different from that expressed in skeletal muscle. Our results using human skeletal muscle suggest that hSGLT3 might be involved in glucose transport following progressive resistance training in diabetic patients. Based on our findings, the co-localization of hSGLT3 with the nicotinic acetylcholine receptor in skeletal muscle at baseline prior to any exercise training, is in accordance with other reports and might support the postulated sensing activity of hSGLT3 [33] in skeletal muscle. However, the increased expression of hSGLT3 in skeletal muscle we found after 16 weeks of resistance exercise without a specific co-localization in the nicotinic acetylcholine receptor is suggestive of an effect on glucose transport per se. This finding, in addition to the significant increase in muscle glycogen storage we observed in skeletal muscle after 16 weeks of resistance exercise training, strongly supports the role of hSGLT3 as a glucose transport and deserves further investigation.
The rate limiting step in the synthesis of glycogen is the transport of glucose across the cell membrane [35], this is why we used muscle glycogen storage as a surrogate for glucose disposal. We found a significant increase in muscle glycogen storage (i.e. glucose disposal) in skeletal muscle after 16 weeks of resistance exercise. This finding suggests that this exercise modality improved glucose uptake via its effect on glucose transport across the cell membrane into the sarcolemma, through the action of hexokinase (although this enzymatic reaction was not measured). Furthermore, we found a significant direct association between enhanced hSGLT3 transcript levels and increased muscle glycogen stores. Taken this together, our data suggest that hSGLT3 but not GLUT4 may have been involved in the observed insulin-independent, exercise-stimulated muscle glucose uptake. Although, this association does not indicate causality and requires further investigation, it suggests a potential role for SLC5 proteins like hSGLT3 in glucose transport. Indeed, our observations and those from others have shown that although individuals with type 2 diabetes are usually insulin resistant, they are not resistant to an exercise-induced muscle glucose uptake [36].
In conclusion, this investigation presents new information on the possible role of human SGLT3, an insulin-independent glucose transport system in skeletal muscle with resistance exercise training. hSGLT3 action appears to be independent of the well known GLUT4, insulin-dependent glucose transporter system. Although the results of this investigation are preliminary given the small sample size available, they suggest a possible mechanism for an exercise-mediated glucose transport system through hSGLT3. Given the rising prevalence of diabetes worldwide, regulation of glucose disposal through activation of the hSGLT3 glucose transport system may represent an important alternative approach to effectively manage diabetes and prevent its long term complications.
Acknowledgements
We are especially grateful for the kind and valuable cooperation of the volunteers who made this study possible. The authors would also like to thank the recruitment, nursing and nutrition services of the Metabolic Research Unit at the HNRCA and the General Clinical Research Center at Tufts-New England Medical Center for their help in undertaking this study; Keiser Sports Health Equipment, Inc. for the donation of the resistance training equipment; Sigrid Rosin-Steiner and Silvia Carambula, VDM, PhD for their technical assistance; and Dr. Rolf K-H. Kinne for his support. This work was presented in part at the Experimental Biology Meeting in San Diego, April 2005. Dr. Carmen Castaneda is a recipient of the Brookdale National Fellowship and the International Life Sciences Institute Future Leader Award.
This work was funded in part by the Brookdale Foundation, the USDA ARS agreement 58‑1950‑9‑001, the NIH General Clinical Research Center M01 RR000054. Any opinions, findings, conclusions, or recommendations expressed in this publication are those of the author(s) and do not necessarily represent the views of the U.S. Department of Agriculture or any of the funding sources.
Conflict of Interest
The authors have declared that no conflict of interest exists.
References
1. Bonadonna RC, Del Prato S, Bonora E. et al. Roles of glucose transport and glucose phosphorylation in muscle insulin resistance of NIDDM. Diabetes. 1996 ;45(7):915-25
2. Wood IS, Trayhurn P. Glucose transporters (GLUT and SGLT): expanded families of sugar transport proteins. British Journal of Nutrition. 2003 ;89(1):3-9
3. Tsao TS, Li J, Chang KS. et al. Metabolic adaptations in skeletal muscle overexpressing GLUT4: effects on muscle and physical activity. FASEB J. 2001 ;15(6):958-69
4. Holloszy JO. A forty-year memoir of research on the regulation of glucose transport into muscle. Am J Physiol Endocrinol Metab. 2003 ;284(3):E453-E67
5. Zorzano A, Santalucia T, Palacin M, Guma A, Camps M. Searching for ways to upregulate GLUT4 glucose transporter expression in muscle. General Pharmacology. 1998 ;31(5):705-13
6. Kennedy J, Hirshman M, Gervino E. et al. Acute exercise induces GLUT4 translocation in skeletal muscle of normal human subjects and subjects with type 2 diabetes. Diabetes. 1999 ;48(5):1192-7
7. Goodyear LJ, Kahn BB. Exercise, glucose transport, and insulin sensitivity. Annu Rev Med. 1998 ;49:235-61
8. Shulman GI. Cellular mechanisms of insulin resistance in humans. The American Journal of Cardiology. 1999 ;84(1A):3J-10J
9. MacLean PS, Zheng D, Jones JP, Olson AL, Dohm GL. Exercise-induced transcription of the muscle glucose transporter (GLUT 4) gene. Biochemical and Biophysical Research Communications. 2002 ;292(2):409-14
10. Kong CT, Yet SF, Lever JE. Cloning and expression of a mammalian Na+/amino acid cotransporter with sequence similarity to Na+/glucose cotransporters. The Journal of Biological Chemistry. 1993 ;268(3):1509-12
11. Dunham I, Shimizu N, Roe BA. et al. The DNA sequence of human chromosome 22. Nature. 1999 ;402(6761):489-95
12. Asano T, Ogihara T, Katagiri H. et al. Glucose transporter and Na+/glucose cotransporter as molecular targets of anti-diabetic drugs. Curr Med Chem. 2004 ;11(20):2717-24
13. Fiatarone MA, Evans WJ. The etiology and reversibility of muscle dysfunction in the aged. J Gerontol. 1993 ;48:77-83
14. Castaneda C, Layne JE, Munoz-Orians L. et al. A randomized controlled trial of resistance exercise training to improve glycemic control in older adults with type 2 diabetes. Diabetes Care. 2002 ;25(12):2335-41
15. Ivy JL. Role of exercise training in the prevention and treatment of insulin resistance and non-insulin-dependent diabetes mellitus. Sports Med. 1997 ;24(5):321-36
16. Evans WJ, Phinney SD, Young VR. Suction applied to a muscle biopsy maximizes sample size. Med Sci Sports Exerc. 1982 ;14(1):101-2
17. Pfaffl MW. A new mathematical model for relative quantification in real-time RT-PCR. Nucleic Acids Res. 2001 ;29(9):e45
18. Livak KJ, Schmittgen TD. Analysis of relative gene expression data using real-time quantitative PCR and the 2(-Delta Delta C(T)) Method. Methods. 2001 ;25(4):402-8
19. Kipp H, Khoursandi S, Scharlau D, Kinne RK. More than apical: Distribution of SGLT1 in Caco-2 cells. Am J Physiol Cell Physiol. 2003 ;285(4):C737-49
20. Cooper ST, Lo HP, North KN. Single section Western blot: improving the molecular diagnosis of the muscular dystrophies. Neurology. 2003 ;61(1):93-7
21. Hughes VA, Fiatarone MA, Fielding RA. et al. Exercise increases muscle GLUT-4 levels and insulin action in subjects with impaired glucose tolerance. Am J Physiol. 1993 ;264(6 Pt 1):E855-62
22. Harris MI, Eastman RC, Cowie CC, Flegal KM, Eberhardt MS. Racial and ethnic differences in glycemic control of adults with type 2 diabetes. Diabetes Care. 1999 ;22(3):403-8
23. Association AD. Standards of Medical Care in Diabetes. Diabetes Care. 2005 ;28(suppl_1):S4-S36
24. Sigal RJ, Kenny GP, Wasserman DH, Castaneda-Sceppa C. Physical activity/exercise and type 2 diabetes. Diabetes Care. 2004 ;27(10):2518-39
25. Hjeltnes N, Galuska D, Bjornholm M. et al. Exercise-induced overexpression of key regulatory proteins involved in glucose uptake and metabolism in tetraplegic persons: molecular mechanism for improved glucose homeostasis. FASEB J. 1998 ;12(15):1701-12
26. Yu M, Blomstrand E, Chibalin AV, Wallberg-Henriksson H, Zierath JR, Krook A. Exercise-associated differences in an array of proteins involved in signal transduction and glucose transport. J Appl Physiol. 2001 ;90(1):29-34
27. Henriksen EJ, Saengsirisuwan V. Exercise training and antioxidants: relief from oxidative stress and insulin resistance. Exercise and Sport Sciences Reviews. 2003 ;31(2):79-84
28. Pessin JE, Thurmond DC, Elmendorf JS, Coker KJ, Okada S. Molecular basis of insulin-stimulated GLUT4 vesicle trafficking. Location! Location! Location!. The Journal of Biological Chemistry. 1999 ;274(5):2593-6
29. Zorzano A, Sevilla L, Tomas E, Camps M, Guma A, Palacin M. Trafficking pathway of GLUT4 glucose transporters in muscle (Review). Int J Mol Med. 1998 ;2(3):263-71
30. Perez-Martin A, Raynaud E, Mercier J. Insulin resistance and associated metabolic abnormalities in muscle: effects of exercise. Obes Rev. 2001 ;2(1):47-59
31. Garvey WT, Maianu L, Zhu JH, Brechtel-Hook G, Wallace P, Baron AD. Evidence for defects in the trafficking and translocation of GLUT4 glucose transporters in skeletal muscle as a cause of human insulin resistance. J Clin Invest. 1998 ;101(11):2377-86
32. Hayashi T, Wojtaszewski JF, Goodyear LJ. Exercise regulation of glucose transport in skeletal muscle. Am J Physiol. 1997 ;273(6 Pt 1):E1039-51
33. Diez-Sampedro A, Hirayama BA, Osswald C. et al. A glucose sensor hiding in a family of transporters. Proc Natl Acad Sci. 2003 ;100(20):11753-8
34. Wright EM, Turk E. The sodium/glucose cotransport family SLC5. Pflugers Arch. 2004 ;447(5):510-8
35. Bouche C, Serdy S, Kahn CR, Goldfine AB. The cellular fate of glucose and its relevance in type 2 diabetes. Endocr Rev. 2004 ;25(5):807-30
36. Sakamoto K, Goodyear LJ. Invited review: intracellular signaling in contracting skeletal muscle. J Appl Physiol. 2002 ;93(1):369-83
Author contact
![]() Corresponding address:
Corresponding address: